

Comment fonctionne un système de surveillance des transformateurs ? Capteurs, architecture et flux de données
发布时间:2026年9月29日 10:14:07
- A transformer monitoring system works by measuring key operating parameters with sensors, converting the signals into digital data, transmitting them to a local host or gateway, and presenting alarms and trends to operators.
- Core sensors cover winding and oil temperature, dissolved gases, partial discharge, bushing condition, OLTC activity, load current and cooling status.
- Data moves through five stages: sensing, signal conditioning, local processing, communication and visualisation.
- Local alarms and relay outputs handle protection actions, while SCADA and dashboards handle supervision and trend analysis.
- Common communication links include RS485 Modbus RTU, Modbus TCP, IEC 61850, IEC 60870-5-104 and DNP3.
- Combining several parameters gives a more reliable picture of transformer health than any single measurement.
- Good installation, calibration and data management determine how much value the system delivers in service.
Table des matières
- 1. What Is a Transformer Monitoring System?
- 2. System Architecture: The Five Layers of Transformer Monitoring
- 3. Sensors: What Is Measured and How
- 4. Signal Conditioning and Data Acquisition
- 5. Data Flow: From Transformer to Control Room
- 6. Local Alarms, Relay Outputs and Protection Logic
- 7. Typical System Technical Parameters
- 8. Online Monitoring vs Periodic Testing
- 9. Installation, Commissioning and Maintenance
- 10. Choosing a Transformer Monitoring System
- 11. Frequently Asked Questions (FAQ)
1. What Is a Transformer Monitoring System? Online Condition Monitoring for Transformateurs de puissance
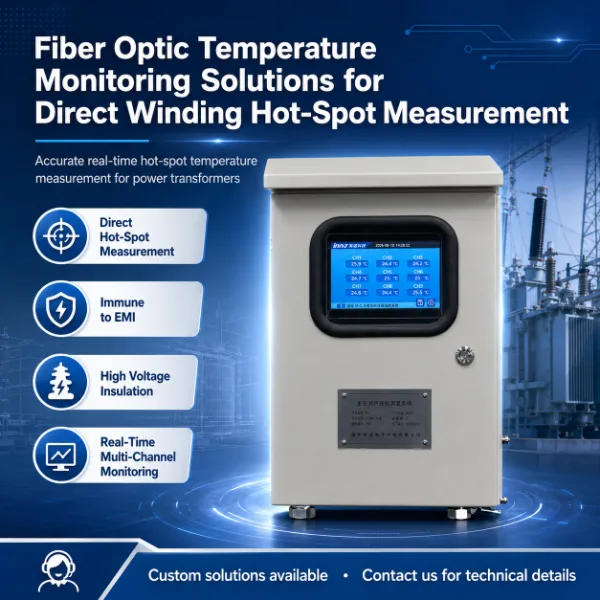
1.1 A transformer monitoring system is a group of sensors, data acquisition units and software that continuously observes the condition of a power transformer while it is in service. It shows operators how hot the windings are, what gases are forming in the oil, whether discharge activity is developing and how the tap changer and bushings are behaving.
1.2 The purpose is to detect abnormal conditions early, protect the transformer from overheating and support condition-based maintenance decisions. Utilities, industrial plants and renewable energy operators use these systems on transformers where an unplanned outage would be costly. See the surveillance des transformateurs solution for an overview of the available modules.
1.3 Applications
Typical uses include surveillance des transformateurs de puissance, oil-immersed transformer monitoring et substation transformer monitoring. Dry-type units use a different set of sensors, described in dry-type transformer temperature monitoring.
1.4 Why Monitoring Is Needed
Thermal stress, electrical stress and moisture gradually degrade the oil-paper insulation. Most failures give some warning through temperature, gas or discharge signals before the transformer trips. A monitoring system captures these signals and turns them into alarms and trends. For failure patterns and detection methods, read this guide to transformer failure modes.
2. Architecture du système: The Five Layers of a Transformer Monitoring System from Sensor to Software
2.1 Most systems follow the same layered structure, whether they monitor one parameter or many. Understanding the layers makes it easier to specify equipment and troubleshoot problems.
| Layer | Role | Typical Equipment |
|---|---|---|
| 1. Sensing | Detect physical quantities on the transformer | Fiber optic probes, Pt100, gas sensors, PD sensors, CTs |
| 2. Signal conditioning | Convert raw signals into clean, scaled values | Demodulators, transmitters, analog inputs |
| 3. Local processing | Apply alarm logic, store data, drive relays | Monitoring host, IED, controller |
| 4. Communication | Send data to remote systems | RS485, Ethernet, gateway, RTU |
| 5. Visualisation and analysis | Display, trend, report and notify | SCADA, historian, dashboard, web interface |
2.2 Centralised versus Distributed Layouts
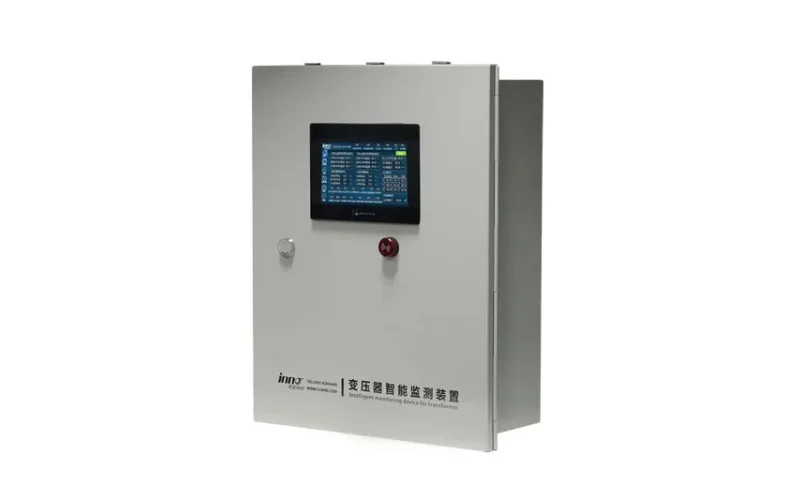
In a centralised layout, one host collects all sensor signals for a transformer. In a distributed layout, each monitoring module (temperature, gas, partial discharge, bushing) has its own controller, and a gateway combines their data. Larger substations often prefer the distributed approach because modules can be added or replaced independently.
2.3 Standalone and Integrated Operation
The system can operate on its own with a local display, or connect to the substation SCADA. Even when connected, local alarms and relay outputs should continue to work if the network fails.
3. Sensors in Transformer Monitoring: Capteurs de température à fibre optique, DGA Sensors, Partial Discharge Sensors and More
3.1 Each sensor type answers a specific question about transformer health. The table below summarises what is usually measured.
| Paramètre | Type de capteur | What It Reveals |
|---|---|---|
| Winding hot-spot temperature | Fiber optic probe in the winding | Thermal stress and insulation ageing rate |
| Température maximale de l'huile | Pt100 or oil temperature indicator | Overall thermal condition and cooling performance |
| Gaz dissous | Online DGA monitor | Overheating, discharge and arcing faults |
| Décharge partielle | UHF, acoustic or HFCT sensors | Insulation defects and voids |
| État des bagues | Capacitance and tan delta sensors on bushing taps | Bushing insulation deterioration |
| OLTC activity | Motor current, position and temperature sensors | Tap changer wear and contact condition |
| Load and voltage | Current and voltage transformers | Loading level and thermal input |
| Oil level and pressure | Level and pressure transmitters | Leaks and internal pressure events |
3.2 Temperature Sensors
3.2.1 Fiber Optic Winding Sensors
Fiber optic probes measure temperature directly at the winding hot spot. They are non-conductive and unaffected by electromagnetic interference. See the fiber optic temperature sensor for transformer winding hot spot monitoring, the capteur de température à fibre optique blindé and the capteur de température à fibre optique en polyimide. The working principle is explained in fiber optic temperature measurement in transformers.
3.2.2 Oil and Winding Indicators
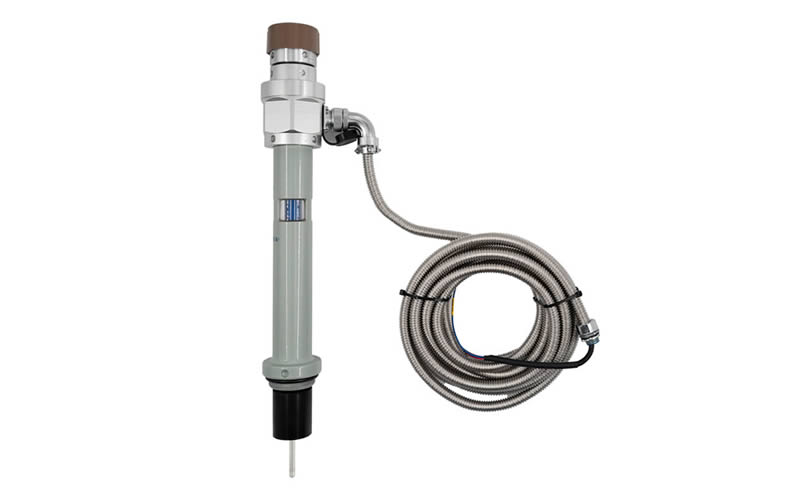
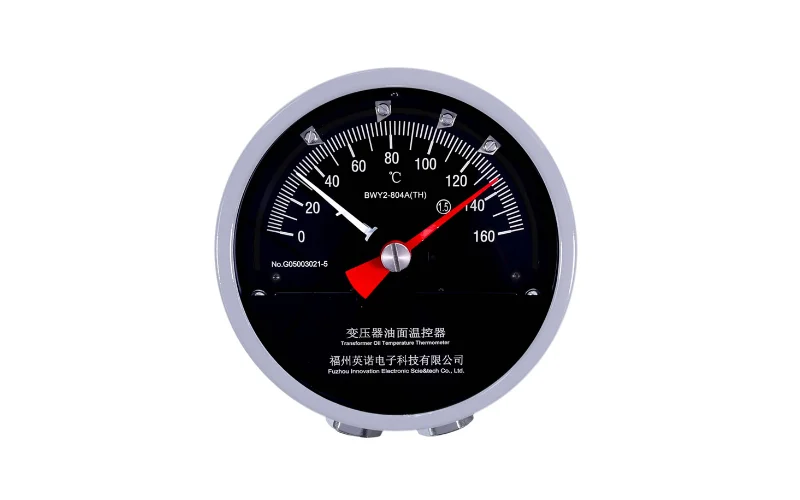
Mechanical instruments provide local readings and switch contacts. Examples are the BWR-04/06AJTH winding temperature indicator and the BWY-802/803A oil temperature indicator.
3.3 Gas, Discharge and Bushing Sensors
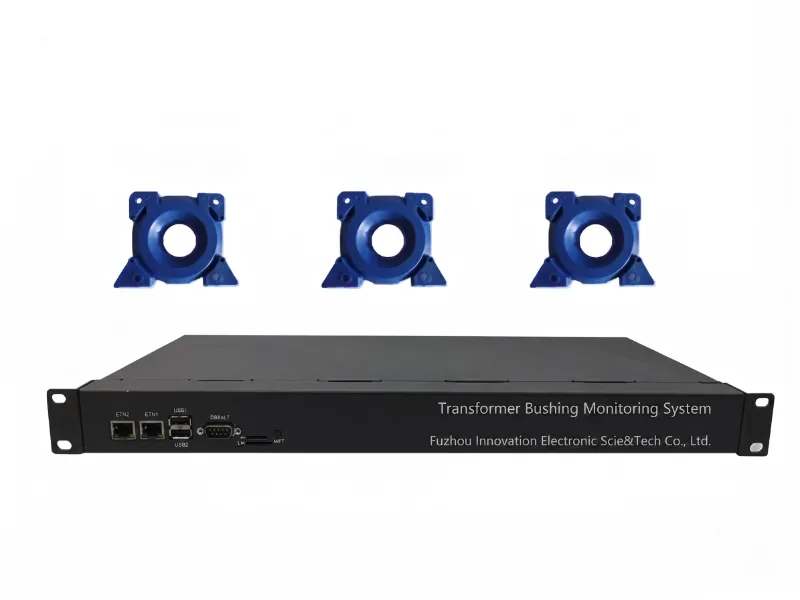
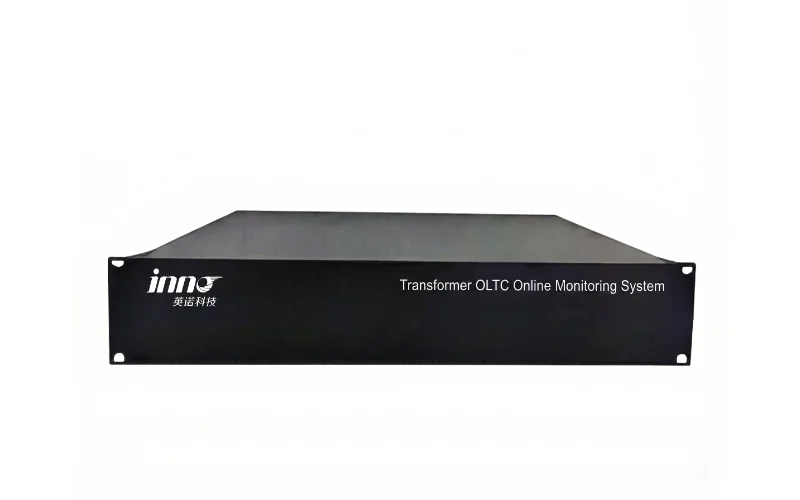
Gas monitoring is covered in transformer online DGA monitoring, partial discharge sensing in partial discharge monitoring in transformers, and bushing sensing in surveillance des traversées de transformateur. Tap changer monitoring is explained in OLTC transformer monitoring.
4. Signal Conditioning et Acquisition de données: Demodulators, Transmitters and Analog-to-Digital Conversion
4.1 Raw sensor signals are rarely usable as they are. A fiber optic probe returns light, a Pt100 returns resistance and a current transformer returns a small AC current. Signal conditioning converts each of these into a stable, scaled digital value.
4.2 How Fluorescent Fiber Optic Temperature Measurement Works
A fluorescent probe contains a phosphor at its tip. The demodulator sends an excitation light pulse down the fiber, and the phosphor emits light that fades at a rate depending on temperature. The instrument measures the decay time and converts it into a temperature reading. Because the reading depends on decay time and not on light intensity, it stays accurate despite fiber bending or connector loss.
4.3 Instruments That Perform This Function
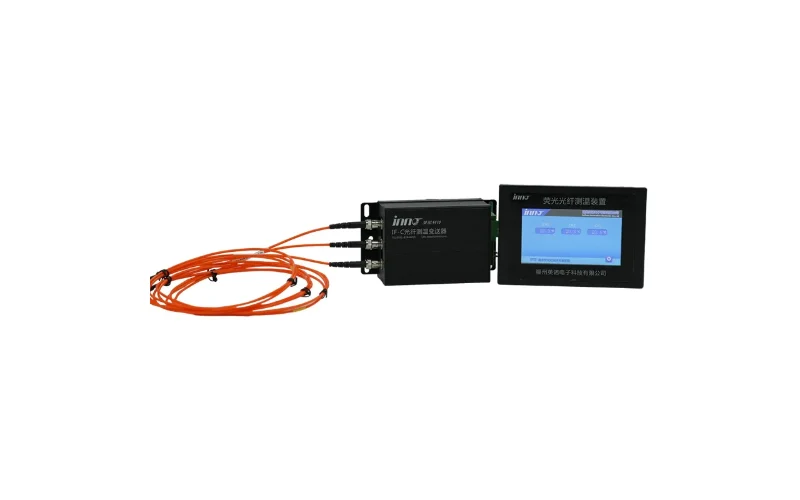
Examples include the single-channel fiber optic temperature sensing module, the IF-G3 3-channel module, the 6-channel fluorescent demodulator and the 3-channel fiber optic temperature transmitter. Extension leads are available as fiber optic temperature sensor extension cables.
4.4 Sampling and Filtering
Acquisition units sample sensors at fixed intervals, apply filtering to reduce noise, and check for sensor faults such as an open circuit or out-of-range value. Each measurement is then time-stamped and stored for transmission.
5. Data Flow in a Transformer Monitoring System: Measurement, Communication, Storage and Analysis
5.1 The path of a single temperature reading illustrates how data moves through the system.
5.2 Step-by-Step Data Path
- Step 1, measurement: the probe in the winding senses temperature.
- Step 2, conversion: the demodulator converts the optical signal into a digital temperature value.
- Step 3, local evaluation: the host compares the value against alarm and trip thresholds and updates relay outputs.
- Step 4, transmission: the value is made available over RS485 Modbus RTU or Ethernet.
- Step 5, gateway translation: a gateway converts the data to the protocol used by SCADA, such as IEC 61850 or DNP3.
- Step 6, storage: the SCADA historian records the value with a time stamp and quality flag.
- Step 7, presentation: the dashboard shows the live value, trend curve and alarm state.
5.3 Communication Options
| Link | Utilisation type | Notes |
|---|---|---|
| RS485 / Modbus RTU | Device to host or gateway | Simple, robust, up to about 1200 m at low baud rates |
| Ethernet / Modbus TCP | Host to SCADA or server | Faster, flexible network topology |
| IEC 61850 | Substation automation | Standard object model and reporting |
| IEC 60870-5-104 / DNP3 | Telecontrol to control center | Event reporting with time stamps |
| 4–20 mA analog | Legacy panels and PLC inputs | One signal per wire pair |
5.4 Local Display and Remote Access
Many hosts include a local screen, such as the hôte intégrant un affichage de température par fibre optique or the fiber optic temperature measurement LCD display instrument, so staff can read values on site even without SCADA.
6. Local Alarms, Relay Outputs and Protection Logic: How the System Reacts to Abnormal Conditions
6.1 Monitoring systems combine measurement with decision logic. The host compares each value with programmed limits and acts on the result.
6.2 Typical Alarm Levels
| Level | Trigger | Typical Action |
|---|---|---|
| Fan control | Winding temperature above fan start point | Start cooling fans, stop at a lower point |
| Alarme | Value above warning limit or fast rate of rise | Send warning to the control room |
| Trip | Value above trip limit | Open breaker through trip relay |
| Fault | Sensor break or communication loss | Raise a maintenance alarm |
6.3 Why Protection Stays Local
Alarm and trip decisions are made inside the monitoring host so that they do not depend on the network. SCADA receives the same information for supervision, but the transformer stays protected even if communication is interrupted.
6.4 Fan and Cooling Control
Controllers such as the fluorescent fiber optic temperature monitoring and control system combine measurement with relay outputs for fan control, alarm and trip.
7. Typical Transformer Monitoring System Technical Parameters: Channels, Accuracy, Outputs and Environment
7.1 The table below lists typical specification ranges for a temperature-based monitoring host. Confirm exact figures against the datasheet of the model you select.
| Paramètre | Typical Specification |
|---|---|
| Measurement channels | 1, 3, 6, 16, 32 or 64 channels (model dependent) |
| Plage de températures | −40 °C to +200 °C (probe dependent) |
| Précision des mesures | ±1 °C (typical) |
| Temps de réponse | About 1 second per update cycle |
| Relay outputs | Alarm, trip and fan control (typically 2 to 6 relays) |
| Communication | RS485 Modbus RTU, Ethernet, additional protocols via gateway |
| Sortie analogique | 4–20 mA (optional) |
| Alimentation électrique | AC/DC 85–265 V or DC 24 V |
| Operating temperature | −25 °C to +65 °C |
| Fiber probe life | Designed to match transformer service life when installed in the winding |
7.2 Larger Multi-Channel Systems
For units with many measuring points, see the système multicanal de mesure et de surveillance de la température par fibre optique and the Système de mesure de température par fibre optique à fluorescence à 64 canaux. A complete package for oil-filled units is shown in the fiber optic temperature measurement system for oil-immersed transformers.
8. Surveillance en ligne vs Contrôles périodiques: What Continuous Data Adds to Transformer Maintenance
8.1 Traditional maintenance relies on scheduled tests: oil sampling, insulation resistance, power factor and thermographic surveys. These give accurate snapshots but can miss events between visits.
8.2 What Continuous Monitoring Adds
- Trend data that shows how fast a condition is changing.
- Immediate alarms for rapid events such as sudden gas generation.
- Records of loading and temperature that explain test results.
- Better timing for outages, based on condition rather than the calendar.
8.3 Online and Offline Methods Work Together
Continuous data does not replace laboratory tests. It tells you when to look closer. For a comparison in the gas monitoring area, read online DGA vs oil sampling. A broader planning approach is covered in transformer condition monitoring methods, parameters and strategy.
9. Installation, Commissioning et Maintenance of Transformer Monitoring Systems
9.1 The quality of installation strongly affects data quality. Plan sensor positions, cable routes and communication wiring before the equipment arrives.
9.2 Installation Considerations
9.2.1 Winding Sensors
Fiber optic probes are normally installed during transformer manufacture, placed at the expected hot spots between winding layers or discs. Retrofit is limited, so decide early whether direct winding measurement is needed.
9.2.2 Oil-Mounted Sensors
Gas monitors, oil temperature sensors and pressure devices connect through valves or pockets on the tank. Use correct fittings and follow the oil handling guidance from the manufacturer.
9.2.3 Cabling and Grounding
Route signal cables away from high-voltage and power circuits. Use shielded cable for RS485, terminate the bus correctly and ground the shield at one end.
9.3 Commissioning Steps
- Check every sensor reading against a reference value.
- Test alarm and trip relays with simulated values.
- Confirm communication with the gateway and SCADA, including scaling and units.
- Record the alarm set points and register map in the asset file.
9.4 Routine Maintenance
Periodically inspect connectors, verify sensor readings against a reference and review alarm history. Keep firmware and configuration backups, and check the time synchronisation of the host.
10. Choosing a Transformer Monitoring System: Selection Criteria for Utilities, Industry and Renewable Plants
10.1 The right system depends on transformer rating, criticality, installation status and existing SCADA. Start with the risks you most need to manage, then add modules to cover them.
10.2 Selection Checklist
- Which failure modes matter most: thermal, insulation, bushing or tap changer?
- Is the transformer new (sensors can be built in) or in service (retrofit options only)?
- Which protocols does the substation or plant SCADA require?
- How many measuring points and outputs are needed?
- What are the site conditions, such as temperature range and electrical noise?
- What documentation, certification and support are available?
10.3 Suitable Industries
Monitoring systems serve power grid and utilities, power generation, renewable energy, substations, rail transit et oil and gas facilities.
10.4 Talk to an Engineer
Please contact us with the transformer rating, voltage class and monitoring goals for a tailored proposal. You can also review our certificates and learn more about us.
11. Frequently Asked Questions (FAQ) about Systèmes de surveillance des transformateurs et Online Transformer Monitoring
1. How does a transformer monitoring system work?
Sensors measure parameters such as temperature, gas and discharge activity. A data acquisition unit converts the signals into digital values, applies alarm logic, and sends the data to SCADA or a dashboard for display and analysis.
2. What parameters does a transformer monitoring system measure?
Common parameters are winding temperature, oil temperature, dissolved gases, partial discharge, bushing condition, tap changer activity, load current, oil level and pressure.
3. What sensors are used in transformer monitoring?
Typical sensors include fiber optic temperature probes, Pt100 sensors, online DGA monitors, UHF or acoustic partial discharge sensors, bushing tap sensors and current transformers.
4. Why use fiber optic sensors for winding temperature?
They measure temperature directly at the winding hot spot, are immune to electromagnetic interference and can be safely placed in high-voltage insulation.
5. What is the difference between monitoring and protection?
Protection acts immediately to trip or control equipment when limits are exceeded. Monitoring records and trends data to reveal developing problems. A monitoring host often does both through relay outputs and communication links.
6. How is data sent from the transformer to the control room?
Data usually travels over RS485 Modbus RTU or Ethernet to a gateway, which converts it to a SCADA protocol such as IEC 61850, IEC 60870-5-104 or DNP3.
7. Can a monitoring system be added to an existing transformer?
Yes, for many parameters. Oil-mounted sensors, gas monitors, bushing sensors and external temperature devices can be retrofitted. Direct winding fiber optic sensors are usually installed during manufacture.
8. What happens if communication fails?
Local alarms and relay outputs continue to work because the host makes those decisions independently. A communication loss alarm is usually raised so maintenance staff can restore the link.
9. How often does a monitoring system update its readings?
Temperature values typically update every second or so, while gas monitors report at their own sampling interval, which can range from hourly to daily.
10. Does online monitoring replace laboratory oil testing?
No. Online data highlights changes and gives early warning, while laboratory tests provide detailed, reference-quality results. Most maintenance programs use both.