

Tableau de bord de surveillance des transformateurs et intégration SCADA : Modbus, RS485, alarmes et architecture des données
发布时间:2026年9月29日 10:10:39
- A transformer monitoring dashboard gathers temperature, gas, partial discharge, bushing and OLTC data into one view so operators can judge asset health at a glance.
- Modbus RTU over RS485 is the most common field link between monitoring devices and a substation gateway, while Modbus TCP, IEC 61850, IEC 60870-5-104 et DNP3 serve higher-level SCADA connections.
- A clean data architecture separates sensors, data acquisition, protocol gateway, SCADA/historian and dashboard layers.
- Good alarm design uses thresholds, rate-of-change rules, deadbands and priority levels to avoid nuisance alarms.
- A documented Modbus register map with scaling, data types and status flags prevents most integration errors.
- Fiable RS485 wiring depends on shielded twisted pair, correct termination, biasing and grounding.
- Time synchronisation, data quality flags and cybersecurity (IEC 62443) protect the value of the recorded data.
Table des matières
- 1. What Is a Transformer Monitoring Dashboard and Why SCADA Integration Matters
- 2. Data Architecture: From Sensors to Dashboard
- 3. Communication Protocols: Modbus, IEC 61850, IEC 60870-5-104 and DNP3
- 4. Modbus RTU and RS485 Wiring and Configuration
- 5. Modbus Register Map Design for Transformer Monitoring Devices
- 6. Transformer Monitoring Host and Gateway: Typical Technical Parameters
- 7. Alarm Design: Thresholds, Rate of Change, Deadband and Priority
- 8. Dashboard Design: Key Views, Trends and Health Indicators
- 9. Time Synchronisation, Historian Storage and Data Quality
- 10. Cybersecurity, Testing and Commissioning Best Practices
- 11. Frequently Asked Questions (FAQ)
1. What Is a Transformer Monitoring Dashboard? Substation Visualisation, Intégration SCADA and Asset Health Data
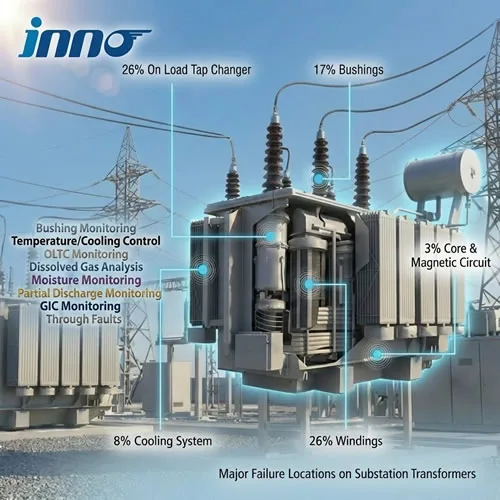
1.1 A transformer monitoring dashboard is a screen or web page that presents live and historical values from one or many transformers. Typical items include winding and oil temperature, dissolved gas levels, partial discharge activity, bushing condition, tap changer operations, loading and cooling status.
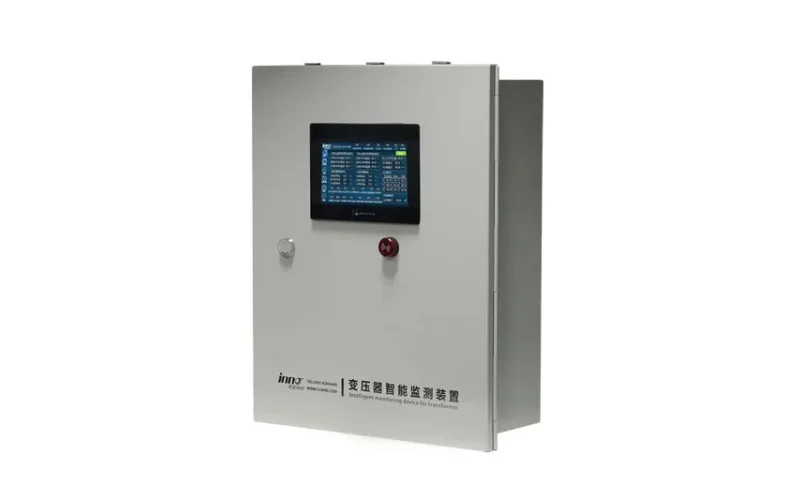
1.2 SCADA integration lets these values reach the control room in the same environment used for breaker status and feeder measurements. Operators then see alarms, trends and equipment status without switching between separate tools. For a wider look at what such a system can include, see the surveillance des transformateurs solution and the surveillance des transformateurs de puissance application page.
1.3 Where These Systems Are Used
Integrated monitoring is used in substations, power grid and utility networks, renewable energy plants and large industrial sites. The substation transformer monitoring application shows a typical deployment.
1.4 Benefits for Operations and Maintenance
Central visibility supports condition-based maintenance, faster fault response and better loading decisions. Historical trends also give maintenance teams evidence to plan outages and justify asset replacement. A broader overview of the parameters involved is available in this guide to transformer condition monitoring methods and parameters.
2. Transformer Monitoring Data Architecture: Sensors, Unité d'acquisition de données, Protocol Gateway, SCADA and Historian
2.1 A well-planned architecture keeps each layer simple and replaceable. The layers below are common in utility and industrial installations.
| Layer | Fonction | Typical Equipment |
|---|---|---|
| 1. Field sensors | Measure temperature, gas, discharge, current and status | Fiber optic probes, Pt100, DGA sensors, PD sensors, bushing sensors |
| 2. Data acquisition | Convert sensor signals into digital values and apply local alarms | Temperature demodulators, monitoring hosts, IEDs |
| 3. Field network | Carry data from devices to the gateway | RS485 (Modbus RTU), Ethernet |
| 4. Protocol gateway / RTU | Translate device protocols to SCADA protocols | Substation gateway, communication manager |
| 5. SCADA and historian | Display, alarm, store and report | SCADA server, historian database |
| 6. Dashboard and reporting | Present trends and health indicators to users | HMI screens, web dashboard, report templates |
2.2 Field Devices That Feed the Dashboard
2.2.1 Temperature Monitoring
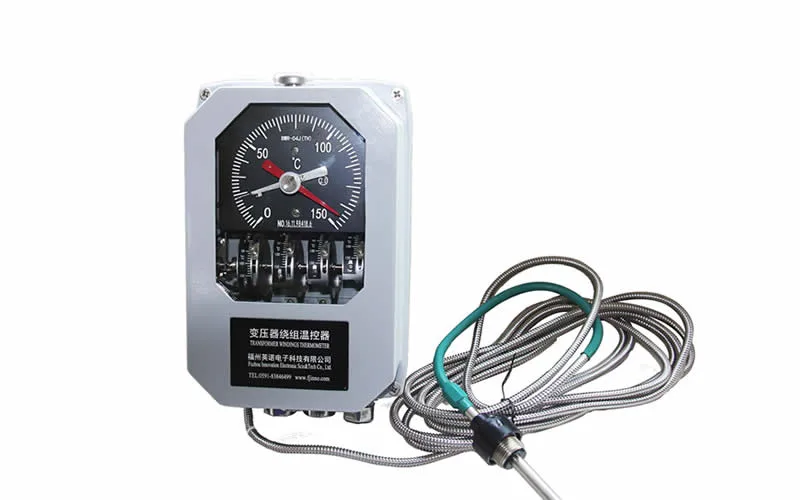
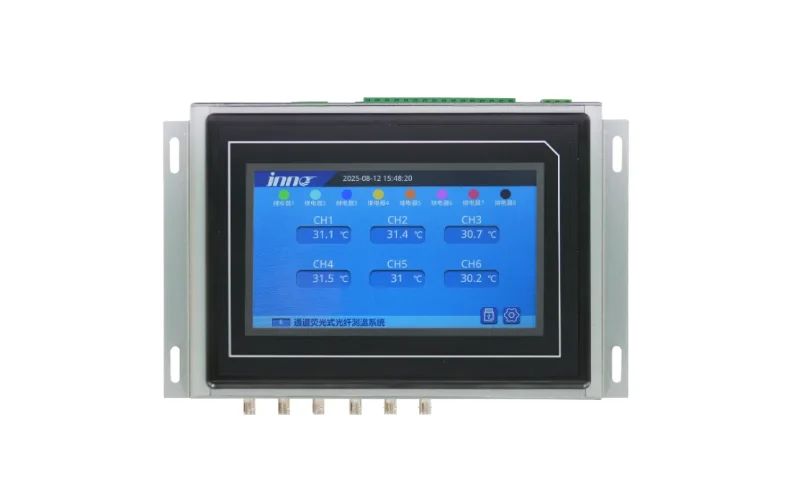
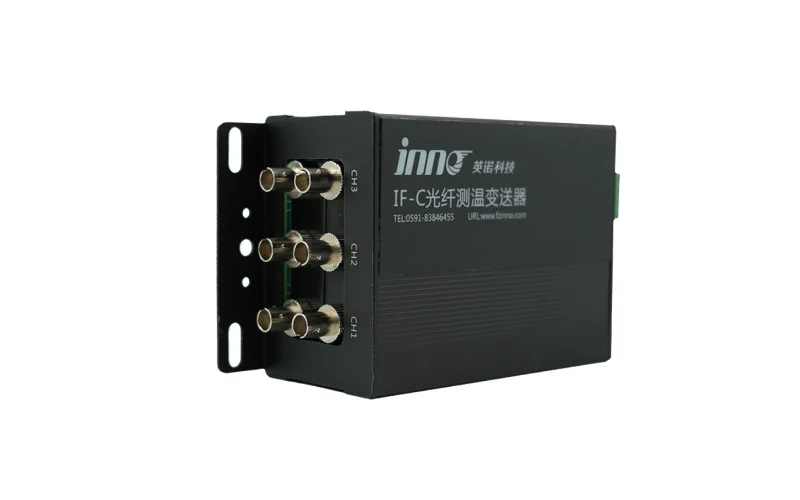
Direct winding temperature data often comes from a système multicanal de mesure et de surveillance de la température par fibre optique. Larger installations may use a Système de mesure de température par fibre optique à fluorescence à 64 canaux, and compact designs use a 6-channel fluorescent fiber optic temperature demodulator or the IF-G3 3-channel fiber optic temperature sensing module.
2.2.2 Display and Local Control
Local display hosts such as the hôte intégrant un affichage de température par fibre optique and the fluorescent fiber optic temperature monitoring and control system provide onsite readings, relay outputs and communication ports.
2.2.3 Gas, Discharge, Bushing and Tap Changer Monitors
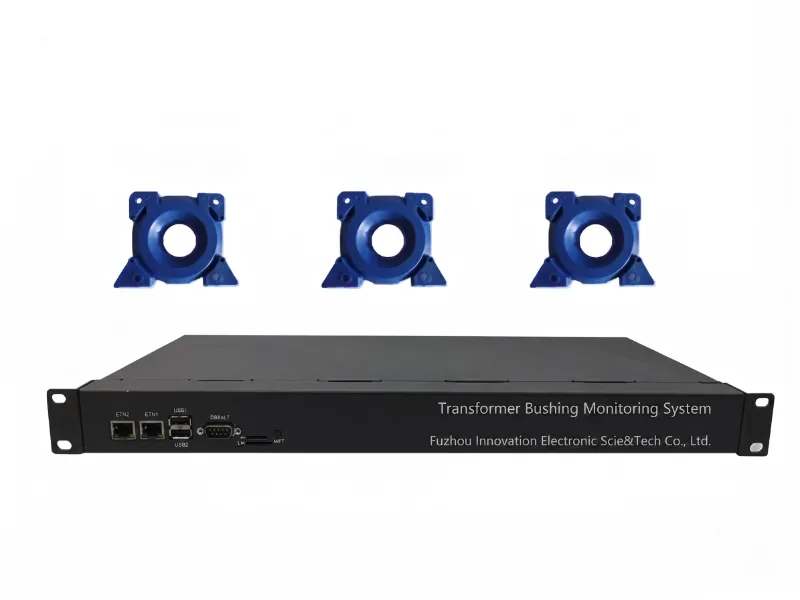
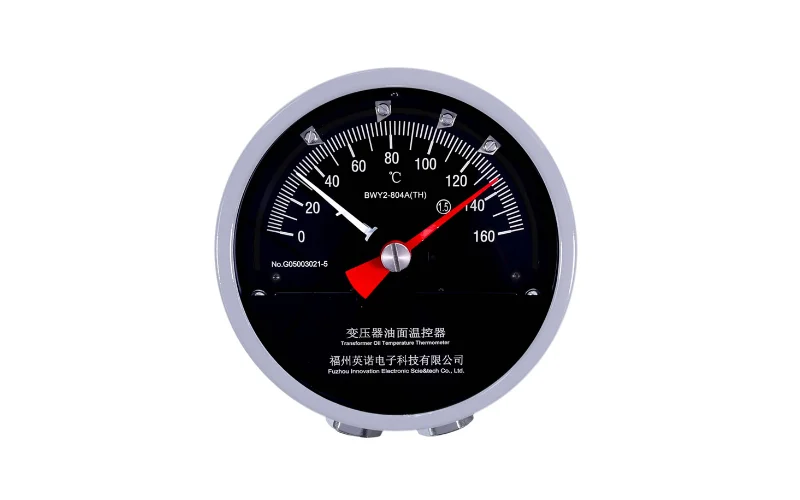
Other devices that commonly join the same network include the online DGA monitoring system, the partial discharge online monitoring system, the système de surveillance des bagues and the OLTC online monitoring system.
2.3 Edge Processing versus Central Processing
Local devices should evaluate basic alarms on their own so protection actions do not depend on network health. Central systems then add trending, cross-parameter analysis and reporting.
3. Communication Protocols: Modbus RTU, Modbus TCP, IEC 61850, IEC 60870-5-104 et DNP3 Compared
3.1 Choose protocols that match both the device and the existing SCADA system. Many projects use Modbus at the device level and a gateway to convert to a utility protocol upstream.
| Protocol | Physical Layer | Utilisation type | Key Characteristics |
|---|---|---|---|
| Modbus RTU | RS485 serial | Device to gateway | Simple, master/slave polling, widely supported |
| Modbus TCP | Ethernet (TCP port 502) | Device or gateway to SCADA | Same data model as RTU over IP networks |
| IEC 61850 | Ethernet | Substation automation | Object-based data model, MMS reporting, GOOSE messaging |
| IEC 60870-5-104 | Ethernet (TCP port 2404) | Telecontrol to control center | Event-driven reporting with time stamps |
| DNP3 | Serial or Ethernet (TCP port 20000) | Utility SCADA | Event buffering, time stamps, unsolicited reporting |
| OPC UA | Ethernet | Enterprise and industrial integration | Secure, structured, platform independent |
3.2 Choosing Between Protocols
Use Modbus for simple, low-cost device links. Use IEC 61850 where substation automation is already built on it. Use IEC 60870-5-104 or DNP3 when the control center expects those standards. Confirm supported protocols in the device manual before ordering, and see the support page for documentation.
4. Modbus RTU over RS485: Wiring, Baud Rate, Termination and Grounding for Transformer Monitoring Devices
4.1 RS485 is a differential, half-duplex serial standard that is well suited to substations because it tolerates long cable runs and electrical noise. Following a few basic rules prevents most communication faults.
4.2 Wiring Rules
- Use shielded twisted-pair cable and connect A, B and signal ground consistently across all devices.
- Wire the network as a daisy chain (bus) rather than a star.
- Place a 120 Ω termination resistor at each end of the bus only.
- Use bias resistors at one point on the bus so the line has a defined idle state.
- Ground the shield at one end to avoid ground loops.
- Keep communication cables separate from power and high-voltage cabling.
4.3 Typical Communication Settings
| Setting | Typical Value | Note |
|---|---|---|
| Baud rate | 9600 or 19200 bps | Lower rates support longer cable runs |
| Data format | 8 data bits, no parity, 1 stop bit (8N1), or 8E1 | Must match on master and all slaves |
| Slave address | 1 to 247 | Every device on the bus needs a unique address |
| Devices per segment | Up to 32 unit loads | Use repeaters to extend |
| Maximum cable length | About 1200 m at low baud rates | Depends on cable quality and environment |
| Common function codes | 03, 04, 06, 16 | Read holding, read input, write single, write multiple |
4.4 Troubleshooting Communication Faults
4.4.1 Common Causes
Typical faults include duplicate slave addresses, swapped A and B wires, mismatched parity, missing termination and polling intervals that are too short. Check settings first, then wiring, then noise sources.
5. Modbus Register Map Design: Scaling, Data Types, Status Flags and Alarm Registers
5.1 A register map is the contract between a monitoring device and the SCADA system. Ask for the map before design starts, and confirm addresses, scaling and byte order with the device manufacturer.
5.2 The table below is an example of how a temperature monitoring device may organise its registers. Actual addresses and scaling differ by model, so always use the manual supplied with the device.
| Register (Example) | Code de fonction | Description | Data Type | Scaling |
|---|---|---|---|---|
| 0x0000 | 03 / 04 | Channel 1 temperature | Signed 16-bit | 0.1 °C per count |
| 0x0001 | 03 / 04 | Channel 2 temperature | Signed 16-bit | 0.1 °C per count |
| 0x0002 | 03 / 04 | Channel 3 temperature | Signed 16-bit | 0.1 °C per count |
| 0x0010 | 03 / 04 | Channel fault status (bit field) | Unsigned 16-bit | 1 bit per channel |
| 0x0020 | 03 / 04 | Alarm status (bit field) | Unsigned 16-bit | 1 bit per alarm |
| 0x0030 | 03 / 06 | Alarm threshold | Signed 16-bit | 0.1 °C per count |
| 0x0031 | 03 / 06 | Trip threshold | Signed 16-bit | 0.1 °C per count |
| 0x00F0 | 03 / 06 | Device slave address | Unsigned 16-bit | 1 |
5.3 Mapping Best Practices
5.3.1 Keep Data Together
Group related values in contiguous blocks so the master can read them in a single request. This reduces bus traffic and keeps readings from different channels aligned in time.
5.3.2 Handle Sensor Faults Explicitly
Use a status register or a defined out-of-range value to flag a broken sensor. Without it, a disconnected probe can look like a valid reading in the dashboard.
5.3.3 Confirm Byte and Word Order
For 32-bit and floating-point values, confirm word order before commissioning. This is one of the most common reasons for readings that look wrong.
6. Transformer Monitoring Host et Communication Gateway: Typical Technical Parameters
6.1 The table below lists typical values for a transformer temperature monitoring host with SCADA communication. Confirm exact specifications against the datasheet of the model you select.
| Paramètre | Typical Specification |
|---|---|
| Measurement channels | 3, 6, 16, 32 or 64 channels (model dependent) |
| Plage de températures | −40 °C to +200 °C (fiber optic probe dependent) |
| Précision | ±1 °C (typical) |
| Communication ports | RS485, Ethernet |
| Protocols | Modbus RTU, Modbus TCP; IEC 61850, IEC 60870-5-104 or DNP3 via gateway (model dependent) |
| Relay outputs | Alarm, trip, fan control (typically 2 to 6 relays) |
| Analog output (optional) | 4 à 20 mA |
| Alimentation électrique | AC/DC 85–265 V or DC 24 V |
| Operating temperature | −25 °C to +65 °C |
| Installation | Panel, rail or wall mount |
6.2 Dry-Type Transformer Devices
Dry-type transformers use compact controllers with built-in communication. Examples include the IB-S201 dry-type transformer temperature monitor and controller, the YN-XP502F-3T dry-type transformer intelligent monitoring device and the intelligent online health monitoring system for dry-type transformers.
7. Alarm Design for Transformer Monitoring: Thresholds, Rate-of-Change Rules, Deadband and Priority Levels
7.1 Alarms should tell operators what is wrong and what to do about it. Too many alarms hide the important ones, so design them deliberately. ISA-18.2 and IEC 62682 describe alarm management practices used across industry.
7.2 Alarm Types
- High and high-high thresholds: a warning level and a critical level for values such as winding temperature.
- Rate-of-change alarms: flag fast increases, for example rising hydrogen in oil, even when absolute values are still low.
- Sensor fault alarms: alert when a probe or communication link fails.
- Multi-parameter alarms: combine signals, such as high temperature with high load, to raise confidence.
- Communication loss alarms: detect when a device stops responding.
7.3 Alarm Priority and Response
| Priority | Example Condition | Suggested Response |
|---|---|---|
| Low (advisory) | Sensor drift, minor communication retries | Log and review at next inspection |
| Medium (warning) | Winding temperature above alarm level, rising gas trend | Check loading and cooling, increase monitoring |
| High (critical) | Winding temperature near trip level, acetylene increase | Reduce load, inspect immediately |
| Trip | Trip threshold exceeded | Automatic protection action |
7.4 Preventing Nuisance Alarms
7.4.1 Deadband and Delay
Apply a deadband so alarms clear only after values drop below the trigger point by a margin. Add a short on-delay to filter momentary spikes, but keep trip signals fast.
7.4.2 Keep Protection Local
Trip and cooling actions should run from local relay outputs, with SCADA acting as monitoring and supervisory control. This keeps protection independent of network availability.
8. Dashboard Design: Key Views, Trend Charts, Health Index and Reporting for Transformer Fleets
8.1 A dashboard should answer three questions quickly: is anything wrong, how serious is it, and what changed. Start with a fleet overview and let users drill into each transformer.
8.2 Recommended Views
- Fleet overview: status colour for each transformer with active alarm counts.
- Transformer detail: winding temperature, oil temperature, load, cooling stage and gas levels on one page.
- Trend view: selectable time ranges with overlays, for example load against temperature.
- Alarm list: sortable by priority, time and acknowledgement status.
- Maintenance view: tap changer operation counts, test dates and inspection notes.
8.3 Health Indicators
Some teams combine multiple parameters into a simple health score. If you do, document how each input is weighted so engineers understand what drives the number. Keep the raw values one click away.
8.4 Pairing Temperature and Gas Data
Temperature trends become more useful when read next to gas data. Learn how gas trends are collected in transformer online DGA monitoring and how oil parameters are tracked in transformer oil temperature, level and pressure monitoring systems. The dissolved gas analysis solution page describes the gas side in more detail.
9. Time Synchronisation, Historian Storage, Polling Intervals and Data Quality in Monitoring Systems
9.1 Reliable analysis depends on accurate time stamps and dependable storage. A trend is only useful if the values line up with the events that caused them.
9.2 Time Synchronisation
Use NTP for general monitoring and IRIG-B or PTP where sequence-of-event accuracy matters. Make sure all devices, gateways and servers share the same reference.
9.3 Polling and Storage
| Data Type | Typical Polling Interval | Typical Storage Approach |
|---|---|---|
| Winding and oil temperature | 1 to 10 seconds | Store on change or at 1-minute averages |
| Load current and voltage | 1 to 5 seconds | Store 1-minute averages with peaks |
| Dissolved gas values | Device sampling interval (hourly to daily) | Store every result with device time stamp |
| Alarm and status events | Event driven or 1 second | Store every event with time and state |
| Partial discharge summaries | Minutes | Store summary statistics and event records |
9.4 Data Quality Flags
Attach a quality flag to each value: good, stale, out-of-range or substituted. Dashboards and reports should hide or mark bad data so it does not distort trends or averages.
10. Cybersecurity, Testing and Commissioning Best Practices for SCADA-Connected Transformer Monitoring
10.1 Once a monitoring system is connected to the control network, it becomes part of the security perimeter. Follow IEC 62443 and applicable regional requirements, such as NERC CIP where relevant.
10.2 Security Measures
- Segment the monitoring network and place firewalls between zones.
- Disable unused ports and services on devices and gateways.
- Change default passwords and use role-based access.
- Restrict remote access and log all sessions.
- Keep firmware and configuration backups under change control.
10.3 Commissioning Checklist
10.3.1 Before Connecting to SCADA
Verify sensor readings against a reference, check RS485 bus quality, confirm slave addresses and export the register map.
10.3.2 Point-to-Point Testing
Simulate or force each value and confirm it reaches the SCADA screen with correct units, scaling and alarm state. Test communication loss, sensor fault and alarm acknowledgement behavior.
10.3.3 Documentation
Keep as-built drawings, register maps, IP and address lists, alarm setpoints and test records with the asset file for future maintenance.
10.4 Get Project Support
For help with device selection, register maps or communication design, contact us with your transformer ratings, protocol requirements and SCADA vendor.
11. Frequently Asked Questions (FAQ) about Surveillance des transformateurs et Intégration SCADA
1. How do I connect a transformer monitoring system to SCADA?
Connect field devices to a gateway or RTU using RS485 Modbus RTU or Ethernet, map the data points, then present them to SCADA through Modbus TCP, IEC 61850, IEC 60870-5-104 or DNP3 depending on your system.
2. Why is Modbus RTU over RS485 so common in transformer monitoring?
It is simple, inexpensive, works over long cable runs and is supported by almost every monitoring device and SCADA package.
3. How many devices can be connected to one RS485 bus?
Up to 32 unit loads on a standard segment, with a valid Modbus address range of 1 to 247. Repeaters allow more devices or longer distances.
4. What is a Modbus register map?
It is a document that lists each data point, its register address, data type, scaling and access rights. SCADA engineers use it to configure the master.
5. What baud rate should I use for RS485?
9600 or 19200 bps is common. Lower rates are more tolerant of long cables and noise, while higher rates improve refresh speed on short buses.
6. What is the difference between Modbus RTU and Modbus TCP?
Both use the same data model. RTU runs over serial lines such as RS485, while TCP runs over Ethernet networks using port 502.
7. Should trip signals go through SCADA?
No. Trip and cooling actions should use local relay outputs so protection works even if the communication network fails. SCADA provides supervision and remote visibility.
8. How do I reduce false alarms in a transformer monitoring dashboard?
Use deadbands, short delays, rate-of-change rules, priority levels and sensor fault detection, and review alarm statistics regularly.
9. What data should a transformer dashboard display?
At minimum: winding and oil temperature, load, cooling status and active alarms. Where available, add dissolved gas values, partial discharge data, bushing condition and tap changer counters.
10. How often should transformer monitoring data be polled?
Temperature and load are commonly polled every 1 to 10 seconds. Gas monitors report at their own sampling interval, which can range from hourly to daily.