

Système de surveillance en ligne des transformateurs : ce qu’il mesure et comment il détecte les anomalies
发布时间:2026年9月29日 10:16:25
- Un online transformer monitoring system measures the transformer while it is energised and in service, so operators see conditions as they develop instead of at the next scheduled test.
- Core measurements include winding temperature, oil temperature, dissolved gases, partial discharge, bushing condition, OLTC activity, load and cooling status.
- Abnormal conditions are detected through fixed thresholds, rate-of-change rules, trend comparison et multi-parameter correlation.
- Each fault type leaves a characteristic signature: hot-spot temperature for overloading, hydrogen for discharge, acetylene for arcing, capacitance drift for bushing defects.
- Sensor checks and data validation prevent false alarms caused by a failed probe or a communication error.
- Alarms are graded by severity, and protection actions run locally through relay outputs.
- Online data supports condition-based maintenance and works alongside laboratory tests rather than replacing them.
Table des matières
- 1. What Is an Online Transformer Monitoring System?
- 2. What an Online Transformer Monitoring System Measures
- 3. Fault Signatures: What Abnormal Conditions Look Like in the Data
- 4. Detection Methods: Thresholds, Rate of Change, Trends and Correlation
- 5. Temperature Monitoring: Detecting Overheating and Hot Spots
- 6. Gas, Partial Discharge and Bushing Monitoring: Detecting Insulation Problems
- 7. OLTC, Cooling and Oil System Monitoring
- 8. Typical Technical Parameters of an Online Monitoring System
- 9. Alarm Grading, Response Actions and False Alarm Control
- 10. Implementation Tips for Utilities, Industry and Renewable Plants
- 11. Frequently Asked Questions (FAQ)
1. What Is an Online Transformer Monitoring System? Continuous Surveillance de l'état des équipements of In-Service Transformers
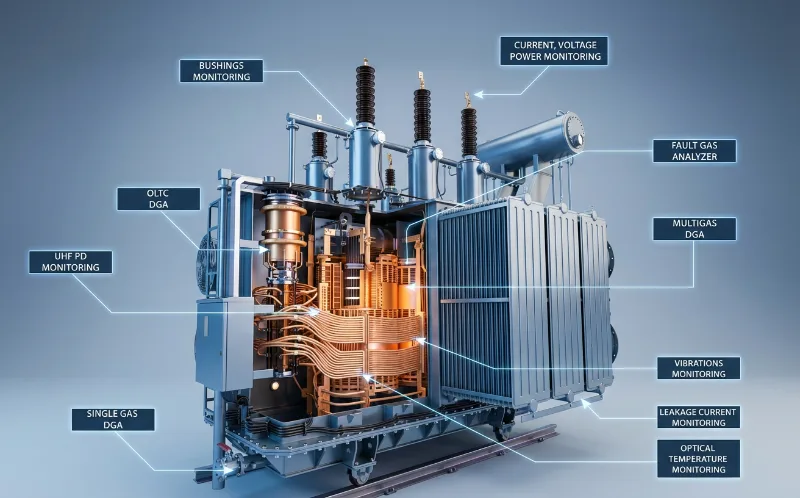
1.1 An online transformer monitoring system is a set of sensors, acquisition units and software that observes a transformer continuously while it carries load. It records key operating quantities, compares them with limits and past behavior, and notifies operators when something looks wrong.
1.2 The value lies in timing. Many transformer problems develop over days or weeks, and some progress within hours. Interval testing can miss short events, while continuous data shows when a change began and how fast it is progressing. The surveillance des transformateurs solution page outlines the modules that make up a complete system.
1.3 Typical Installations
Systems are used in surveillance des transformateurs de puissance, oil-immersed transformer monitoring et substation transformer monitoring. Dry-type transformers follow a temperature-focused approach, covered in dry-type transformer temperature monitoring.
1.4 Monitoring versus Protection
Protection relays act on faults within milliseconds. Monitoring looks at slower changes in condition, such as gradual gas build-up or rising temperature at constant load. The two functions complement each other, and a monitoring host often supports both through alarm and trip relays.
2. What an Online Transformer Monitoring System Measures: Température, Dissolved Gas, Décharge partielle, Douilles and Load
2.1 The table below lists the main measured quantities and the reason each one matters.
| Measured Quantity | Typical Sensor | Pourquoi est-ce important ? |
|---|---|---|
| Winding hot-spot temperature | Fiber optic probe in winding | Sets insulation ageing rate and loading capability |
| Température maximale de l'huile | Pt100 or oil temperature indicator | Shows cooling performance and overall thermal state |
| Dissolved gases in oil | Online DGA monitor | Reveals overheating, discharge and arcing |
| Moisture in oil | Oil moisture sensor | Affects insulation strength and paper ageing |
| Décharge partielle | UHF, acoustic or HFCT sensors | Indicates insulation defects and voids |
| Bushing capacitance and tan delta | Bushing tap sensors | Detects bushing insulation deterioration |
| Tap changer signals | Motor current, position, temperature | Shows wear and contact problems |
| Load current and voltage | CT and VT inputs | Explains thermal behavior and stress |
| Oil level and pressure | Level and pressure transmitters | Detects leaks and internal pressure events |
| État du refroidissement | Fan and pump contacts, current | Confirms the cooling system works as expected |
2.2 Choosing What to Monitor
Start with the risks that matter most for the asset. Thermal monitoring suits almost every transformer, gas monitoring adds early insulation warning, and bushing and OLTC monitoring address two common sources of failure. See transformer condition monitoring methods and parameters for a planning framework.
3. Fault Signatures: What Abnormal Conditions Look Like in Transformer Monitoring Data
3.1 Each fault mechanism produces a recognisable pattern across several measurements. Recognising these patterns is the basis of detection.
| Abnormal Condition | Primary Indicators | Supporting Indicators |
|---|---|---|
| Overloading | Rising winding and oil temperature with load | Fans running continuously, CO and CO2 increase |
| Cooling system failure | Oil temperature rising at normal load | Fan or pump status fault, higher temperature gradient |
| Local overheating (hot spot, circulating current) | Ethylene and methane rising, hot-spot temperature elevated | Temperature not explained by load |
| Décharge partielle | PD activity, hydrogen rising | Methane increase, PD pattern changes |
| Arc électrique | Acetylene and hydrogen jump | PD bursts, protection events |
| Bushing defect | Capacitance or tan delta drift | Increasing leakage current, local heating |
| Tap changer contact wear | OLTC motor current or temperature rise | Acetylene from diverter switching |
| Moisture ingress | Moisture in oil rising | Lower bubbling temperature, hydrogen increase |
| Oil leak | Oil level dropping | Pressure changes, temperature rise |
3.2 Why Patterns Matter More Than Single Values
A single elevated reading is often ambiguous. Two or three indicators moving together give much stronger evidence of a real fault. For example, rising ethylene alongside a hot-spot temperature that does not track load is a clearer sign of local overheating than either value alone. For the gas side, see the guide to transformer failure modes, causes and detection methods.
4. Detection Methods: Fixed Thresholds, Rate of Change, Trend Comparison et Multi-Parameter Correlation
4.1 Monitoring systems use several detection techniques together. Each catches a different type of problem.
4.2 Fixed Thresholds
The simplest method compares a value with a set limit, such as a winding temperature alarm level or a gas concentration limit. Thresholds are easy to understand and work well for hard limits, but they can respond late to slow changes and early to harmless spikes.
4.3 Rate-of-Change Rules
Rate-of-change detection watches how quickly a value moves. A hydrogen level that is still low but doubling within days may deserve more attention than a stable, higher value. Rate rules are especially valuable for gas monitoring because standards such as IEC 60599 and IEEE C57.104 place weight on gas generation rate.
4.4 Trend and Baseline Comparison
4.4.1 Comparing with Normal Behavior
The system stores normal operating behavior, for example the relationship between load and winding temperature. When new readings drift away from this baseline, an advisory alarm can flag the change even if no hard limit has been crossed.
4.4.2 Comparing Across Similar Units
Where several similar transformers operate under similar conditions, comparing their readings can reveal one that behaves differently from the rest.
4.5 Multi-Parameter Correlation
4.5.1 Rule-Based Correlation
Combined rules raise confidence. Examples include high temperature with normal load and fans running (possible internal heating), or hydrogen rise with increasing PD activity (likely insulation defect). Correlation reduces both missed detections and false alarms.
4.6 Detection Methods Compared
| Méthode | Best At Detecting | Main Limitation |
|---|---|---|
| Fixed threshold | Clear limit violations | Slow to flag gradual change |
| Rate of change | Fast-developing faults | Sensitive to noisy data |
| Trend and baseline | Slow drift from normal behavior | Needs a good history |
| Multi-parameter correlation | Confirming real faults | Needs several working sensors |
| Sensor and data validation | Instrument faults and bad data | Cannot detect transformer faults itself |
5. Surveillance de la température: Detecting Overheating et Winding Hot Spots with Fiber Optic Sensors
5.1 Temperature is the most widely monitored parameter because it links directly to insulation life and loading capability. Detection compares measured hot-spot temperature with limits, load and cooling status.
5.2 How Overheating Is Identified
- Winding temperature above the alarm or trip limit.
- Temperature rising faster than load would explain.
- Oil-to-winding gradient increasing over time, which may point to restricted oil flow.
- Temperature high while fans and pumps show normal status.
5.3 Direct Measurement
Fiber optic probes measure the hot spot itself rather than estimating it. Read more in transformer winding hot spot temperature measurement and monitoring sensors et fiber optic temperature measurement in transformers. Product options include the fiber optic temperature sensor for winding hot spot monitoring, the armored fiber optic sensor and the polyimide fiber optic sensor.
5.4 Acquisition Equipment
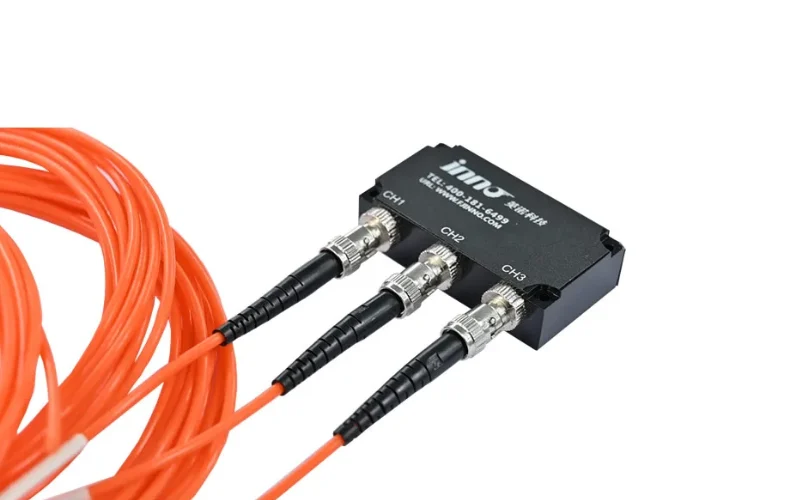
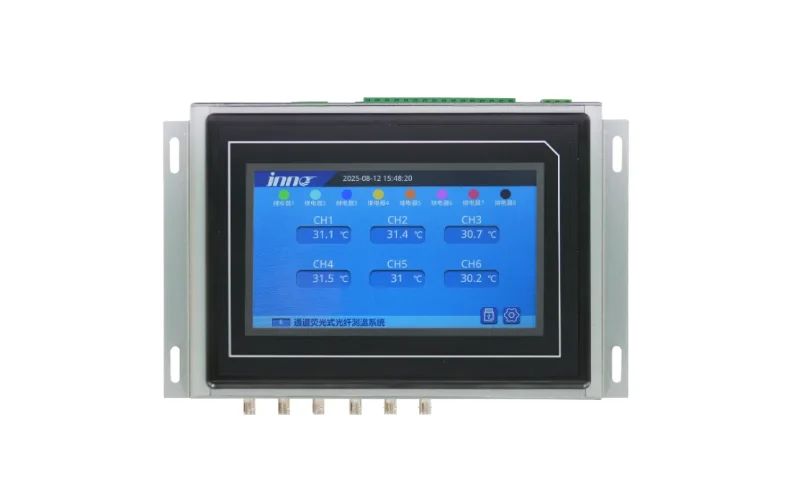
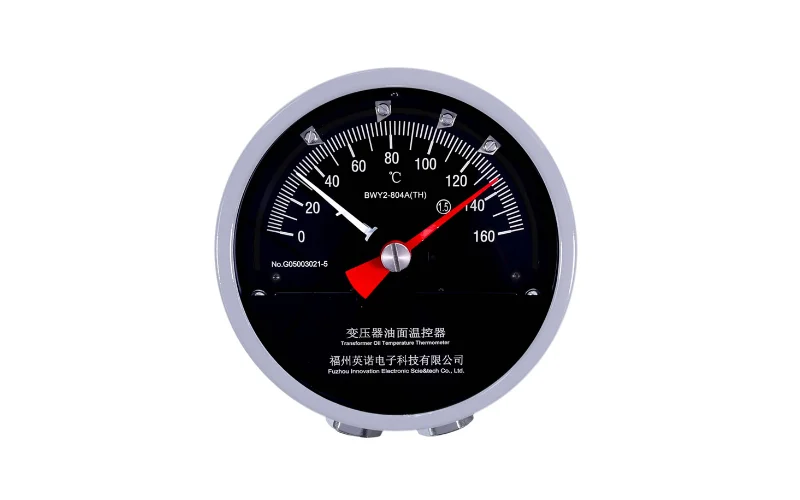
Signals from probes are processed by units such as the IF-G3 3-channel sensing module, the 6-channel fluorescent demodulator or the système multicanal de mesure et de surveillance de la température par fibre optique. Traditional indicators remain useful as a backup; see the BWR-04/06AJTH winding temperature indicator and the BWY-802/803A oil temperature indicator.
6. Dissolved Gas, Décharge partielle et Surveillance des bagues: Detecting Insulation Problems Early
6.1 Insulation faults often start small. Gas, discharge and bushing measurements are sensitive to these early stages.
6.2 Gas Monitoring
An online DGA monitor measures gases such as hydrogen, methane, ethylene and acetylene at set intervals. Detection combines concentration limits, generation rates and gas ratios. Learn more in transformer online DGA monitoring, the online DGA monitoring system for transformer oil and the dissolved gas analysis solution. For sampling trade-offs, see online DGA vs oil sampling.
6.3 Partial Discharge Monitoring
6.3.1 What the System Looks For
PD sensors record the intensity and repetition of discharge pulses. Detection focuses on increasing activity, changing pulse patterns and consistent activity in a particular phase. See partial discharge monitoring in transformers and the système de surveillance en ligne des décharges partielles des transformateurs.
6.4 Bushing Monitoring
6.4.1 Capacitance and Tan Delta Drift
Bushing sensors measure leakage current through the bushing tap and derive capacitance and dissipation factor. A slow drift or a difference between phases can indicate deterioration. Details are in surveillance des traversées de transformateur and the système de surveillance des traversées de transformateur.
7. Suivi OLTC, Système de refroidissement et Niveau d'huile Monitoring: Mechanical and Auxiliary Conditions
7.1 The tap changer is a mechanical device with moving contacts and is a common source of maintenance issues. Monitoring looks at motor current, operation time, position and compartment temperature.
7.2 OLTC Detection Logic
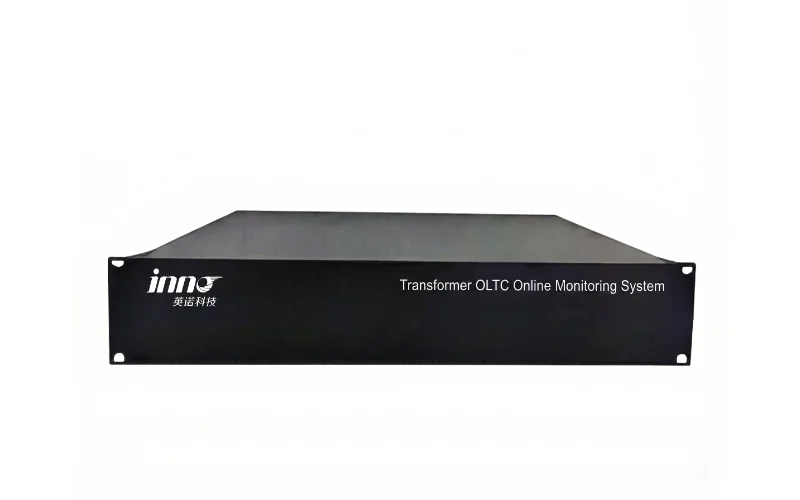
Changes in motor current profile, longer operation times or a temperature difference between the tap changer and main tank indicate wear or contact trouble. Learn more in OLTC transformer monitoring and the transformer OLTC online monitoring system.
7.3 Cooling and Oil System
Fan and pump status, oil temperature and oil level are combined to confirm the cooling system is doing its job. See transformer oil temperature, level and pressure monitoring systems.
8. Typical Caractéristiques techniques of an Online Transformer Monitoring System
8.1 The table below lists typical specification ranges for a temperature-based monitoring host. Confirm exact values against the datasheet of the model you select.
| Paramètre | Typical Specification |
|---|---|
| Measurement channels | 1, 3, 6, 16, 32 or 64 channels (model dependent) |
| Plage de températures | −40 °C to +200 °C (probe dependent) |
| Précision des mesures | ±1 °C (typical) |
| Update interval | About 1 second |
| Alarm outputs | Alarm, trip and fan control relays (typically 2 to 6) |
| Communication | RS485 Modbus RTU, Ethernet; IEC 61850, IEC 60870-5-104 or DNP3 via gateway |
| Sortie analogique | 4–20 mA (optional) |
| Alimentation électrique | AC/DC 85–265 V or DC 24 V |
| Environnement d'exploitation | −25 °C to +65 °C |
| Stockage des données | Local logging with export to SCADA or historian |
8.2 Display and Control Units
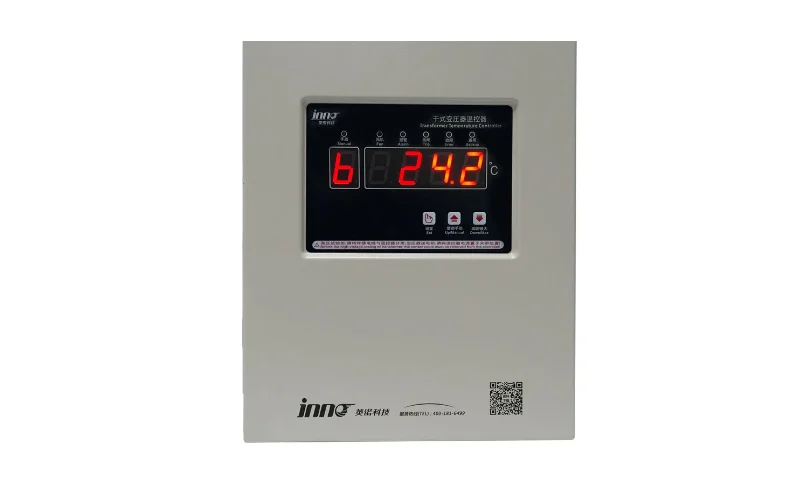
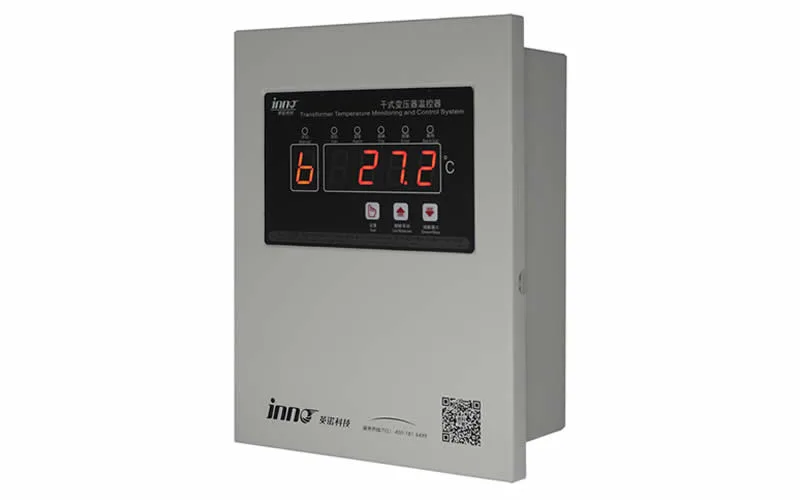
Local hosts include the hôte intégrant un affichage de température par fibre optique, the fluorescent fiber optic temperature monitoring and control system and the Système de mesure de température par fibre optique à fluorescence à 64 canaux. For dry-type units, see the IB-S201 dry-type transformer temperature monitor and controller.
9. Alarm Grading, Response Actions and False Alarm Control in Online Monitoring
9.1 An alarm is useful only if operators know how serious it is and what to do. Grading alarms by severity keeps attention on what matters.
| Grade | Exemple | Suggested Response |
|---|---|---|
| Advisory | Slow drift from baseline, minor sensor warning | Log and review at next inspection |
| Warning | Winding temperature above alarm level, rising gas rate | Check load and cooling, shorten sampling interval |
| Critical | Acetylene rise, temperature near trip level, strong PD increase | Reduce load, inspect promptly, plan outage |
| Trip | Trip limit exceeded | Automatic protection action |
9.2 Controlling False Alarms
9.2.1 Sensor and Data Validation
The system checks for out-of-range values, frozen readings and communication loss. Suspect data is flagged and excluded from alarm logic so that a failed probe does not look like a transformer fault.
9.2.2 Deadband and Delay
A deadband stops alarms from repeatedly switching on and off near a limit. A short delay filters brief spikes, while trip signals remain fast.
9.2.3 Correlation Before Escalation
Escalating an alarm only when two or more related indicators agree reduces nuisance alerts without hiding real problems.
9.3 Recording and Review
Store alarm events with time stamps, values and operator acknowledgements. Regular review of alarm statistics helps refine set points over time.
10. Implementation Tips: Selecting and Commissioning an Online Monitoring System for Utilities, Industrial Plants et Énergies renouvelables
10.1 A successful project starts with a clear list of risks and ends with tested alarm logic and documented settings.
10.2 Practical Steps
- Define which failure modes are most important for the transformer.
- Decide whether winding sensors can be installed during manufacture.
- Confirm communication protocols with the SCADA vendor.
- Set initial alarm limits from the transformer test report and applicable standards.
- Test every alarm and relay output during commissioning.
- Review the data after the first months of operation and refine thresholds.
10.3 Industries
Online monitoring is applied across power grid and utilities, power generation, renewable energy, substations, rail transit et oil and gas.
10.4 Talk to an Engineer
Please contact us with your transformer rating, voltage class and monitoring goals. You can also review our certificates or learn more about us.
11. Frequently Asked Questions (FAQ) about Online Transformer Monitoring et Abnormal Condition Detection
1. What does an online transformer monitoring system measure?
Typical measurements include winding and oil temperature, dissolved gases, partial discharge, bushing capacitance and tan delta, tap changer signals, load, oil level, pressure and cooling status.
2. How does the system detect abnormal conditions?
It uses fixed thresholds, rate-of-change rules, comparison with normal behavior and correlation between several measurements to identify conditions that need attention.
3. What is the difference between a threshold alarm and a rate-of-change alarm?
A threshold alarm triggers when a value crosses a set limit. A rate-of-change alarm triggers when a value rises quickly, even if it is still below the limit.
4. Can online monitoring detect partial discharge?
Yes. UHF, acoustic or HFCT sensors record discharge pulses, and the system tracks their intensity and pattern over time. Rising hydrogen in oil often supports the finding.
5. How does the system tell overload from a real internal fault?
It compares temperature with load and cooling status. Temperature that follows load is consistent with overloading, while temperature or gas that rises without matching load points to an internal cause.
6. What causes false alarms in transformer monitoring?
Common causes include failed sensors, electrical noise, communication errors and thresholds set too close to normal operating values. Data validation, deadbands and correlation rules reduce them.
7. Does online monitoring replace laboratory oil testing?
No. Online data provides continuous trends and early warning, while laboratory tests give detailed reference results. Most programs use both.
8. How quickly can the system detect a developing problem?
Temperature values update about every second. Gas monitors report at their own sampling interval, which may be hourly to daily, and discharge activity is tracked continuously or in short intervals.
9. What happens when an alarm is triggered?
The host operates alarm or trip relays as configured and sends the event to SCADA. Operators then follow the response procedure for that alarm grade.
10. Can a monitoring system be added to a transformer already in service?
Yes, for most parameters. Oil-mounted sensors, gas monitors and bushing sensors can be retrofitted. Direct winding fiber optic sensors are normally installed during manufacture.