

Liste de contrôle pour la maintenance prédictive des transformateurs
Date de publication :14 octobre 2026, 15 h 16 min 15 s
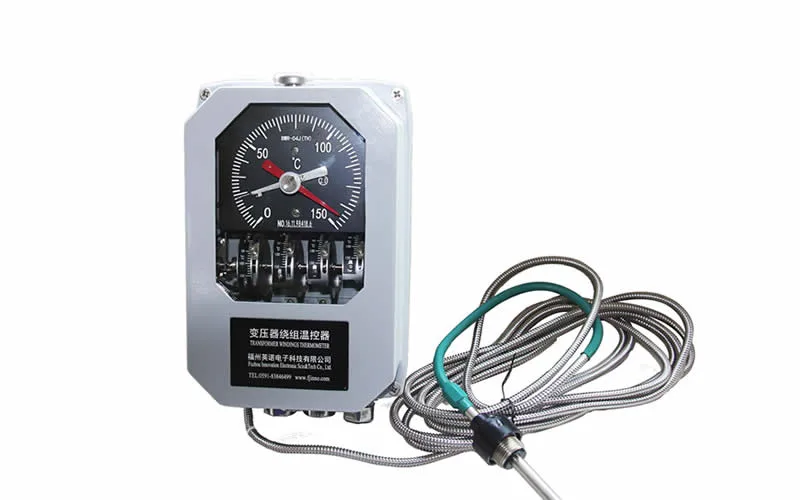
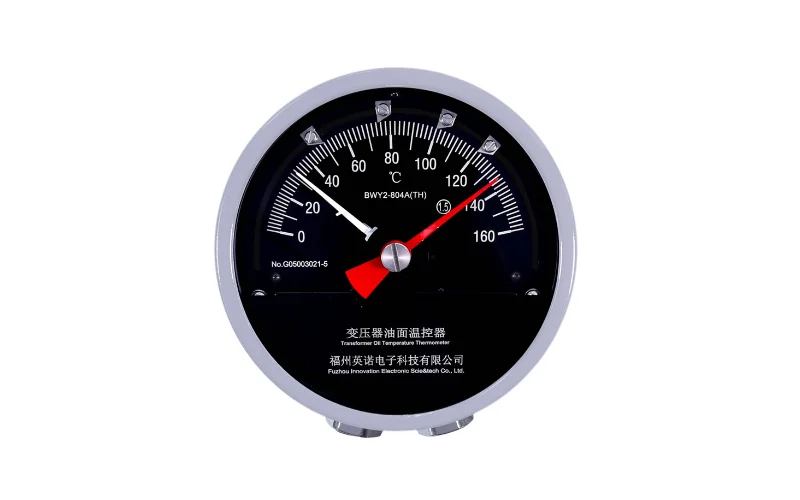
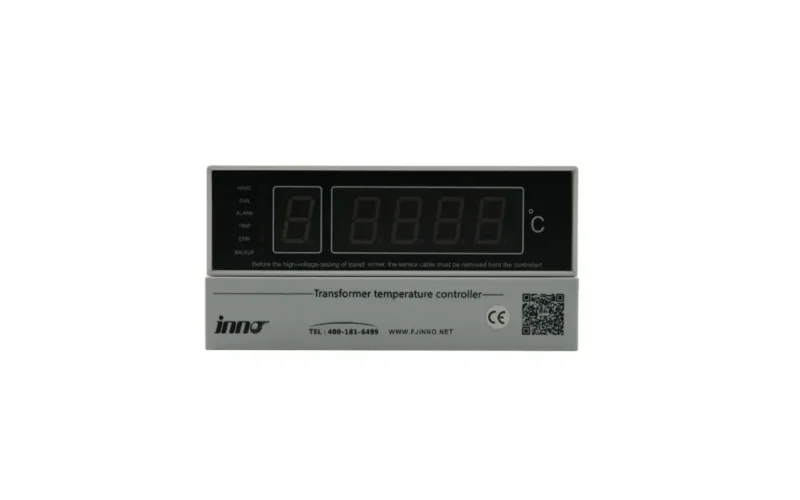
- Winding and hot-spot temperature trends, read against load, ambient temperature and cooling status.
- Dissolved gas trends and gas rate of change in oil-immersed transformers, not single oil samples.
- Partial discharge activity and insulation condition, including moisture and dielectric indicators where they are measured.
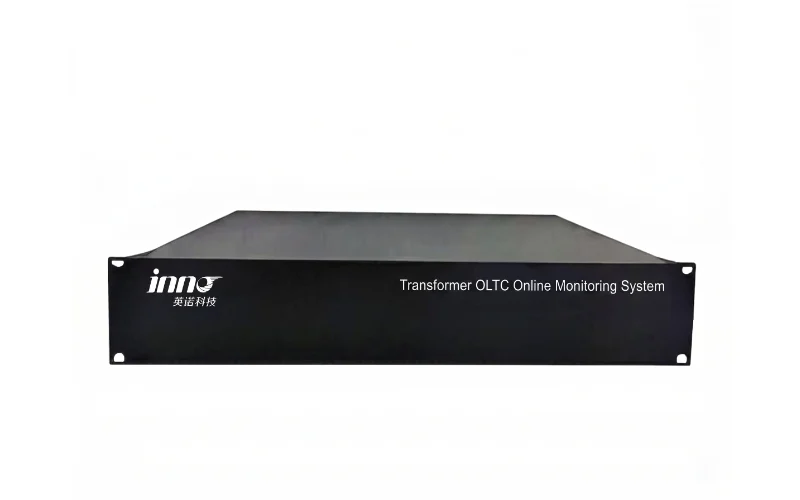
- État des douilles et du transformateur à tension variable en ligne (OLTC): capacitance, dielectric loss, motor current, vibration, torque and switching history.
- Performances de refroidissement: fan and pump status compared with winding and oil temperature response.
- Load, alarm and sensor-health history, so every condition trend is interpreted in its operating context.
Transformer predictive maintenance should be based on trends from multiple condition indicators rather than one isolated measurement. Monitoring data becomes useful once it moves through a clear chain: trend analysis, condition assessment, maintenance priority, then a defined inspection or diagnostic action.
Table des matières
- 1. Predictive vs Preventive Transformer Maintenance
- 2. Temperature and Hot-Spot Trends
- 3. DGA and Oil-Condition Indicators
- 4. Partial Discharge and Insulation Condition
- 5. Bushing, OLTC and Cooling-System Checks
- 6. Transformer Predictive Maintenance Checklist
- 7. Turning Monitoring Data into Maintenance Priorities
- 8. Transformer Predictive Maintenance FAQ
1. Predictive vs Preventive Transformer Maintenance
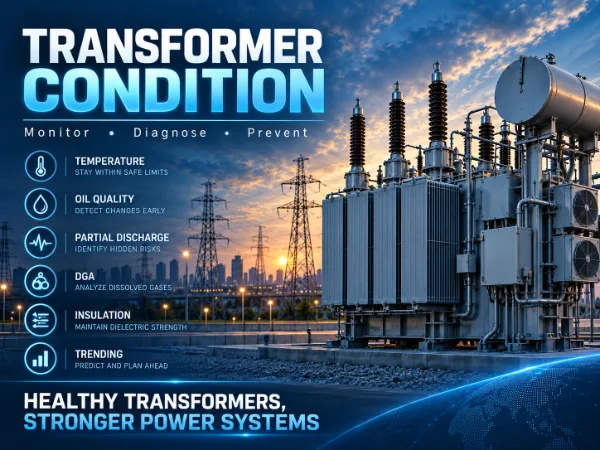
Preventive maintenance follows the calendar. Condition-based maintenance acts on the measured condition of the asset. Predictive maintenance goes one step further: it uses condition trends and operating history to identify deterioration before failure, or before a fixed maintenance interval would have caught it.
Continuous surveillance de l'état des transformateurs supplies the data history that predictive decisions depend on. Without trend data, maintenance teams can only react to individual alarms or scheduled test results.
| Maintenance Approach | Decision Basis | Typical Trigger | Main Limitation |
|---|---|---|---|
| Preventive | Time, operating hours or operation count | Fixed interval reached | Work may happen too early or too late for the actual condition |
| Condition-Based | Current measured condition | Value reaches a preset alarm or inspection limit | Responds once a limit is crossed, often with little lead time |
| Predictive | Condition trends, rate of change and operating history | Developing deterioration identified in trend data | Requires reliable long-term data and multi-indicator interpretation |
2. Temperature and Hot-Spot Trends
Temperature data is usually the first layer of a power transformer predictive maintenance program. Useful inputs include winding temperature, top-oil temperature, direct hot-spot temperature, load current, ambient temperature and cooling status. Each answers a different question, so no single reading should be judged in isolation.
Temperature should be interpreted together with load and cooling condition. A high reading during peak load with all cooling stages running may be expected. A similar reading at moderate load, or a slower recovery after load reduction, deserves closer review.
2.1 Trends That Matter More Than Absolute Values
- Rate of temperature change after a load step
- Temperature rise per unit of load compared with the asset's own history
- Persistent differences between phases or winding sections
- Repeated overheating events across similar load cycles
- Slower cooling response after fans or pumps start
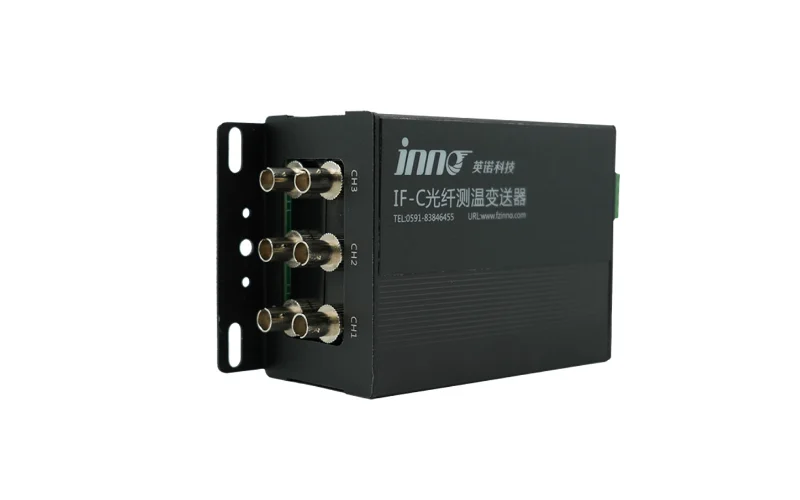
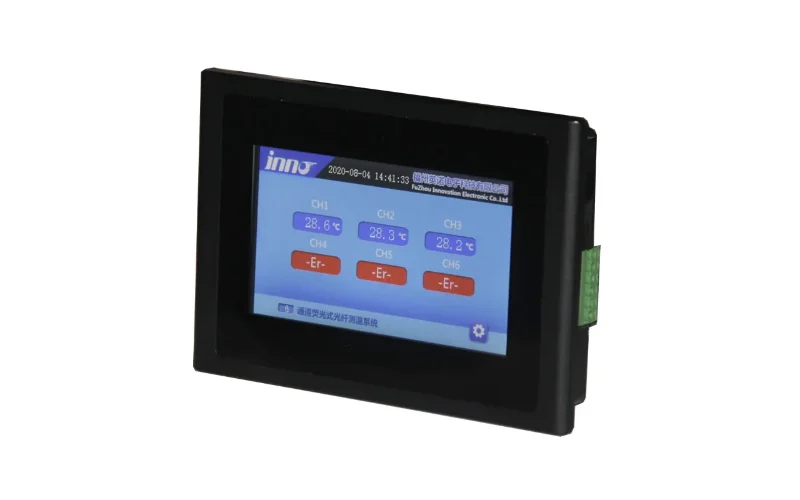
Estimated winding temperature depends on a thermal model and design assumptions. Direct measurement from winding hot-spot monitoring with fiber optic sensors shows how selected internal winding locations actually respond to load and cooling, which makes thermal trends easier to compare over time.
3. DGA and Oil-Condition Indicators
DGA trends are usually more useful for predictive maintenance than one isolated sample. A single result shows where gas levels stand; a series of results shows whether a thermal or electrical condition is developing, stable or accelerating.
Key points to track in dissolved gas analysis notamment :
- Which fault gases are rising, and whether they rise together
- Gas rate of change between consecutive measurements
- Correlation between gas trends and oil or winding temperature
- Moisture and general oil condition where these are measured
- Changes that follow load events, switching or cooling faults
Gas-ratio methods described in IEC 60599 and the condition interpretation approach in IEEE C57.104 help classify likely fault types. Limits and interpretation should follow the applicable standard, manufacturer guidance and the asset's own baseline rather than a generic number.
Continuous data from an online dissolved gas monitoring system tracking seven fault gases can reveal changes between laboratory samples that may justify further diagnostic testing. Laboratory DGA remains valuable for detailed confirmation.
4. Partial Discharge and Insulation Condition
Partial discharge activity is an early electrical indicator of localized insulation weakness, such as voids, surface tracking or floating-potential contacts. Insulation deterioration often progresses gradually, so the trend matters more than any single PD reading.
PD activity should be evaluated by trend, operating context and diagnostic evidence. Questions worth asking include:
- Is discharge magnitude or repetition rate increasing over weeks or months?
- Does activity change with load, temperature or voltage?
- Do UHF, HFCT or ultrasonic sensors confirm the same source?
- Are DGA, moisture or dielectric indicators changing at the same time?
Continuous surveillance des décharges partielles with PRPD and PRPS pattern analysis helps separate genuine discharge from substation noise. Severity assessment should combine PD data with transformer design, insulation structure and other condition information, since no universal acceptable limit applies to every asset.
5. Bushing, OLTC and Cooling-System Checks
5.1 Bushing Condition
Bushing condition should be tracked separately from main-tank indicators, because a bushing can deteriorate while other transformer data looks normal. Online surveillance des bagues can follow capacitance, dielectric loss, total or leakage current and, where configured, partial discharge. Gradual drift in these values is often more informative than any single reading.
5.2 OLTC Condition
OLTC trends reveal mechanical wear that thermal and oil data may not show. Useful indicators include operation count, motor current, vibration, torque, temperature in the operating area and tap position history. Rising motor current or torque during switching, changing vibration signatures or position mismatch can point to increasing mechanism resistance. Continuous Suivi OLTC records these signals for each switching event.
5.3 Cooling Performance
Cooling performance links directly to thermal trends. Track fan and pump status, winding and oil temperature response after cooling stages switch on, and the relationship between load and temperature. A cooling stage that runs but produces a weaker temperature response than before suggests reduced cooling effectiveness.
6. Transformer Predictive Maintenance Checklist
Use the transformer maintenance checklist below as a structure for reviewing online transformer monitoring data. Actions are diagnostic steps, not final conclusions.
| Monitoring Area | What to Track | Trend to Watch | Possible Maintenance Action |
|---|---|---|---|
| Température d'enroulement | Winding temperature vs load and ambient | Higher temperature at similar load than in past periods | Compare; Review loading |
| Hot-Spot Temperature | Direct hot-spot values by phase and section | Persistent hot point or growing phase difference | Verify; Increase monitoring frequency |
| Température maximale de l'huile | Top-oil temperature vs load and cooling stage | Slower recovery after load reduction | Compare; Check cooling system |
| Charger | Load profile, peaks and overload duration | More frequent or longer high-load periods | Review loading |
| Cooling Fans / Pumps | Run status, starts and temperature response | Weaker temperature drop after cooling starts | Check cooling system; Inspect |
| DGA | Fault gas levels and rate of change | Sustained gas increase or acceleration | Schedule diagnostic testing; Increase monitoring frequency |
| Humidité | Moisture and oil condition where measured | Gradual upward drift | Test; Compare |
| Décharge partielle | Magnitude, repetition rate and pattern | Increasing activity or new discharge pattern | Verify; Schedule diagnostic testing |
| État des bagues | Capacitance, dielectric loss, current | Steady drift from baseline | Compare; Test |
| OLTC Condition | Motor current, torque, vibration, operations | Rising current or torque during switching | Inspect; Plan maintenance |
| Alarm History | Alarm type, frequency and clustering | Repeated alarms of the same type | Review loading; Verify |
| Communication / Sensor Health | Data gaps, frozen values, sensor faults | Missing or implausible readings | Verify; Inspect |
7. Turning Monitoring Data into Maintenance Priorities
Not every abnormal value calls for immediate maintenance. A transformer maintenance strategy built on predictive data sorts findings into priority levels, so effort goes where deterioration is most likely developing. The levels below are conceptual and do not represent numeric thresholds.
- Level 1 — Normal Trend: values and trends stable within the asset's history.
- Level 2 — Watch / Increased Monitoring: a small but consistent change in one indicator.
- Level 3 — Diagnostic Review: several indicators changing together, or one changing at an accelerating rate.
- Level 4 — Planned Maintenance: diagnostic evidence confirms deterioration that needs scheduled work.
| Condition Pattern | Recommended Response |
|---|---|
| Stable value + stable trend | Continue routine monitoring |
| Small but consistent change | Increase monitoring frequency |
| Multiple indicators changing together | Schedule condition assessment |
| Temperature rise + DGA change + cooling abnormality | Investigate combined thermal condition |
| PD trend increase + insulation indicators changing | Plan diagnostic review |
| Repeated alarms with sensor or communication faults | Verify data quality before further action |
Maintenance decisions should combine multiple indicators, transformer design, manufacturer guidance and operating history. Correlated changes carry more weight than a single parameter moving alone, and data quality should be confirmed before any trend drives action. Feeding all indicators into SCADA or a remote monitoring platform makes this cross-check practical for maintenance planning across a fleet.
8. Transformer Predictive Maintenance FAQ
8.1 What is predictive maintenance for transformers?
Predictive maintenance for transformers uses condition trends, rates of change and operating history to identify developing deterioration before failure. Instead of following a fixed schedule or waiting for an alarm limit, maintenance teams prioritize inspection and diagnostic testing based on how temperature, gas, discharge and mechanical indicators are changing over time.
8.2 What transformer parameters are used for predictive maintenance?
Common parameters include winding, hot-spot and top-oil temperature, load, ambient temperature, cooling status, dissolved gases, moisture, partial discharge, bushing capacitance and dielectric loss, and OLTC motor current, vibration and torque. Alarm history and sensor health are also tracked, so trends can be trusted and read in context.
8.3 How does DGA support transformer predictive maintenance?
DGA shows chemical evidence of thermal and electrical faults inside oil-immersed transformers. Tracking which gases rise and how quickly helps reveal whether a condition is developing or accelerating. Online DGA adds continuous trend data between laboratory samples, helping teams decide when further diagnostic testing is justified.
8.4 What is the difference between preventive and predictive transformer maintenance?
Preventive maintenance is performed at fixed time or operation intervals, regardless of actual condition. Predictive maintenance uses monitoring trends and operating history to decide when work is needed. Predictive programs can bring forward work on deteriorating units and avoid unnecessary intervention on healthy ones, but they depend on reliable long-term condition data.