

Transformer Health Monitoring System: From Sensor Data to Condition Assessment
发布时间:2026年10月4日 09:29:02
Installing sensors on a transformer is the easy part. The real challenge is turning thousands of readings per day into a clear answer to the questions asset owners actually ask: Is this transformer healthy? How fast is it aging? Can it carry more load? Does it need attention now, next year or not at all?
A transformer health monitoring system answers those questions by connecting four layers: sensors that measure physical quantities, data acquisition that turns them into reliable digital records, analytics that interpret what the data means, and condition assessment that converts the interpretation into decisions. This article walks through each layer, explains the diagnostic methods used at each step, and shows how the results come together in a health index and a maintenance plan.
Table des matières
- What Is a Transformer Health Monitoring System?
- The Four-Layer Architecture
- Layer 1: Sensors and Measured Parameters
- Layer 2: Data Acquisition and Data Quality
- Layer 3: Analytics and Diagnostics
- Layer 4: Condition Assessment and Health Index
- From Health Index to Maintenance Decisions
- Oil-Immersed vs Dry-Type Transformer Health Monitoring
- Implementation Roadmap
- FAQ
What Is a Transformer Health Monitoring System?
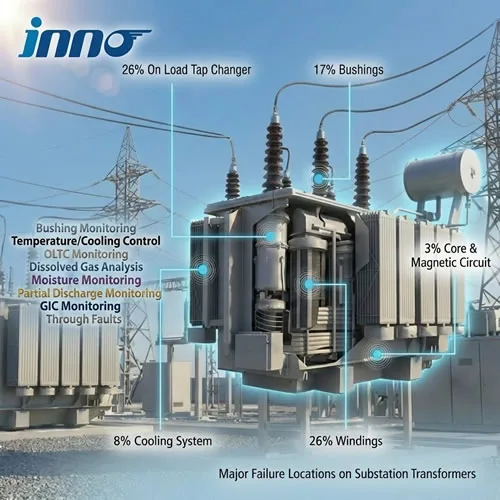
A transformer health monitoring system continuously collects data about a transformer's thermal, electrical, chemical and mechanical condition, then evaluates that data to estimate the transformer's current health, rate of deterioration and remaining useful life. It differs from basic monitoring in one important way. Basic monitoring tells you what is happening, such as a top-oil temperature of 82 °C. Health monitoring tells you what it means, such as "insulation is aging at 1.8 times the normal rate during evening peaks, and cooling stage 2 appears underperforming."
The benefits are practical:
- Early fault detection before incipient defects develop into failures
- Condition-based maintenance instead of fixed intervals, reducing unnecessary outages
- Safe dynamic loading based on actual thermal conditions rather than conservative nameplate limits
- Fleet-level investment planning by ranking transformers on condition and risk
- Life extension by identifying and correcting causes of accelerated aging
For an overview of the monitoring options that feed a health system, see our transformer monitoring solutions.
The Four-Layer Architecture
| Layer | Fonction | Exemple de résultat |
|---|---|---|
| 1. Sensing | Measure temperature, gases, electrical and mechanical quantities | Raw signals |
| 2. Acquisition | Digitize, time-stamp, validate and store data | Clean, synchronized time series |
| 3. Analytics | Apply thermal models, DGA interpretation, trend and correlation analysis | Diagnoses such as "thermal fault in oil, 300 to 700 °C" |
| 4. Assessment | Combine diagnoses into health index, risk ranking and recommendations | Health score, remaining life estimate, action plan |
Each layer depends on the one below it. Sophisticated analytics cannot compensate for a poorly placed sensor or a data stream full of gaps. That is why a successful project gives equal attention to all four layers.
Layer 1: Sensors and Measured Parameters
A health monitoring system should cover the main subsystems of the transformer, because failures can start in any of them. The table below shows how sensors map to subsystems.
| Subsystem | Key Parameters | Typical Sensors |
|---|---|---|
| Windings and thermal system | Hot-spot temperature, top- and bottom-oil temperature, ambient, load current | Fiber optic probes, Pt100 sensors, temperature indicators, CTs |
| Insulation and oil | Dissolved gases, moisture in oil, partial discharge | Online DGA monitor, moisture sensor, UHF/HFCT/acoustic PD sensors |
| Douilles | Capacitance, tan delta, leakage current | Test tap adapters and bushing monitor |
| On-load tap changer | Tap position, operation count, motor current, diverter oil temperature | OLTC monitor, current transducers, temperature sensors |
| Tank, oil preservation and cooling | Oil level, pressure, fan and pump status, cooler temperatures | Level and pressure transmitters, auxiliary contacts |
| Core | Core and clamp ground current | Clamp-on current sensors |
Why Direct Hot-Spot Measurement Matters
Winding hot-spot temperature is the single most important input for estimating insulation aging. Traditional winding temperature indicators calculate hot spot from top-oil temperature and load current, which works reasonably well in steady state but can lag or misjudge during rapid load changes, overloads and cooling faults. Fluorescent fiber optic sensors measure the hot spot directly at the winding, with full immunity to high voltage and electromagnetic interference.
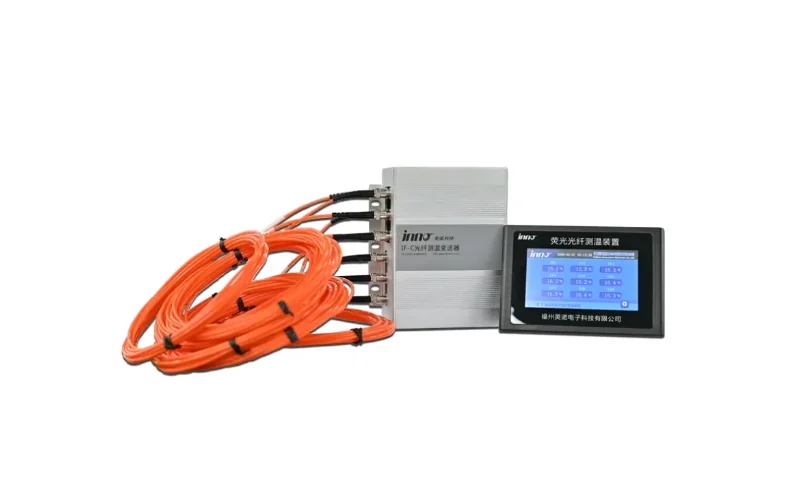
Typical products for this layer include the fiber optic sensor for winding hot-spot monitoring, armored fiber optic sensors for oil-immersed windings and a 3-channel fiber optic temperature transmitter for one probe per phase. For a full discussion of measurement methods, see transformer winding hot-spot temperature measurement and sensors.
Condition Sensors for Insulation, Bushings and OLTC
Thermal data alone cannot reveal arcing, partial discharge or bushing deterioration. A complete health system adds:
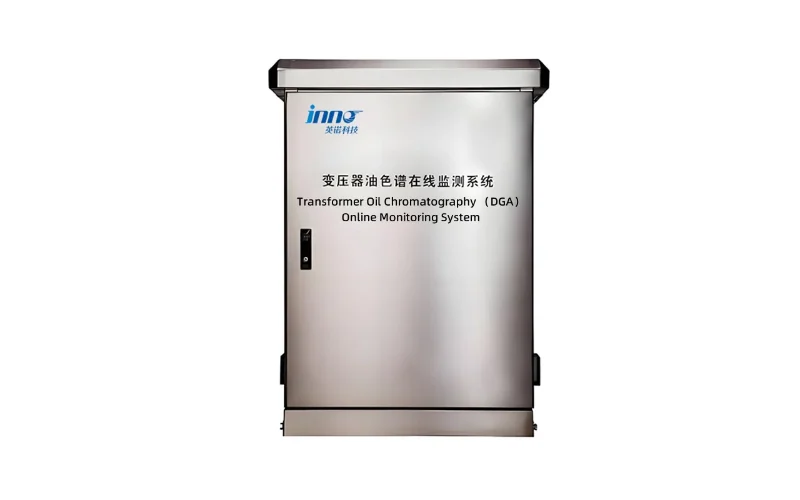
- Un online DGA monitoring system for fault gases and moisture
- A partial discharge online monitoring system for insulation defects
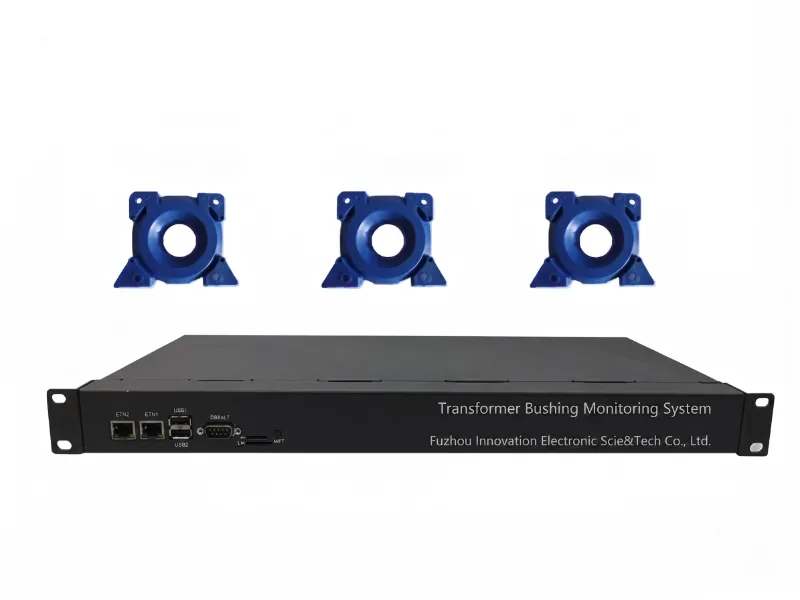
- A système de surveillance des bagues for capacitance and tan delta
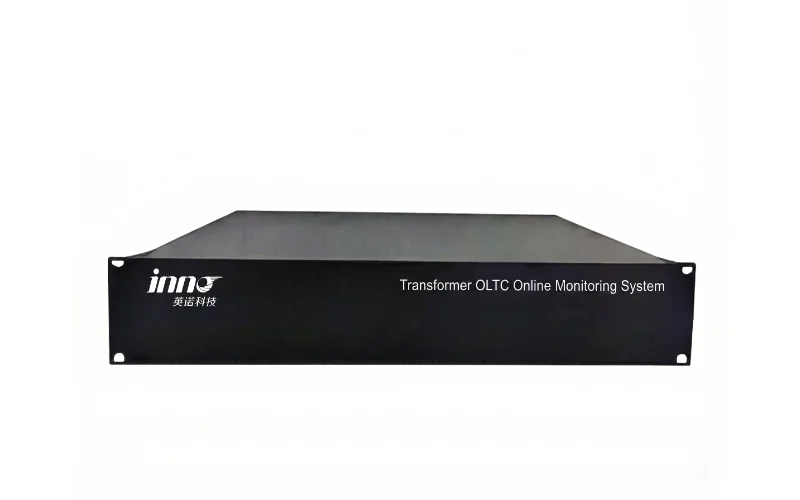
- A transformer OLTC online monitoring system for mechanical and contact wear
- A transformer oil temperature, level and pressure monitoring system for leaks and pressure events
Layer 2: Data Acquisition and Data Quality
The acquisition layer collects signals from every sensor, converts them to digital values with time stamps and makes them available to analytics. It is often underestimated, yet most problems in practical health monitoring trace back to poor data rather than poor algorithms.
Fonctions principales
- Synchronization. All devices should share a common time source, for example SNTP or IEEE 1588 PTP, so that a gas increase can be matched with the load peak or temperature excursion that caused it.
- Appropriate sampling rates. Temperatures and DGA change slowly and can be recorded every few minutes or hours. Partial discharge and bushing signals need high-speed acquisition with local processing.
- Local buffering. The monitoring unit should store data locally during communication outages and forward it afterward.
- Standard interfaces. Modbus, IEC 61850, DNP3 or IEC 60870-5-104 allow integration with substation automation and enterprise systems.
Data Quality Checks
| Check | Exemple |
|---|---|
| Range check | A top-oil reading of −40 °C in summer indicates a sensor or wiring fault |
| Rate-of-change check | A hot-spot jump of 30 K in one second is physically impossible and should be flagged |
| Consistency check | Hot spot lower than top-oil temperature under load suggests a mislabeled channel or faulty probe |
| Stuck-value check | A value that never changes for days may indicate a frozen sensor or communication fault |
| Cross-validation | Compare online DGA results with periodic laboratory samples |
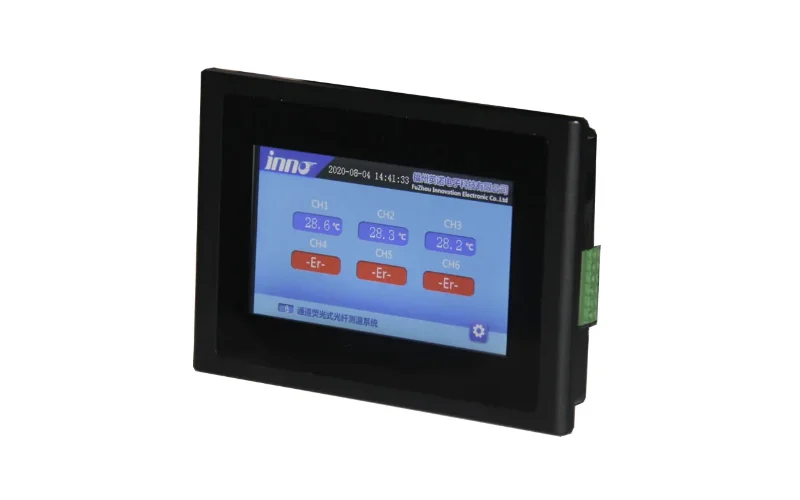
Readings that fail checks should be flagged rather than silently deleted, so analysts can see when and why data was excluded. Local displays such as a fiber optic temperature display host also help field staff spot sensor problems quickly.
Layer 3: Analytics and Diagnostics
The analytics layer turns clean data into diagnoses. Most health monitoring systems use a combination of physics-based models, established interpretation standards and statistical trending.
Thermal Modeling and Insulation Aging
The life of a transformer is largely the life of its paper insulation, and paper aging is driven mainly by temperature, moisture and oxygen. IEC 60076-7 describes the relative aging rate of non-thermally upgraded paper as doubling for roughly every 6 K increase in hot-spot temperature above 98 °C:
V = 2(θh − 98) / 6
At a hot spot of 98 °C the aging rate is 1. At 110 °C it is about 4, so one hour at 110 °C consumes roughly the same life as four hours at 98 °C. Thermally upgraded paper uses a different reference (110 °C in both IEC 60076-7 and IEEE C57.91). Integrating V over time gives the cumulative loss of life, which is a central output of any health system.
Thermal models also support:
- Dynamic loading: calculating how much overload is possible for a given duration without exceeding hot-spot limits
- Cooling performance checks: comparing measured temperatures with the model's expected values to detect blocked radiators or failed fans
- Hot-spot prediction for the next few hours based on forecast load and ambient temperature
Our article on transformer temperature rise limits and ratings explains the thermal limits behind these calculations.
Dissolved Gas Interpretation
DGA is the most established diagnostic tool for internal faults in oil-immersed transformers. Analytics typically combine several methods:
| Méthode | How It Works | Utilisation type |
|---|---|---|
| Key gas method | Identifies the dominant gas associated with each fault type | Quick first indication |
| Gas levels and rates of increase | Compares concentrations and rates against limits (IEEE C57.104, IEC 60599) | Deciding whether a fault is active and how urgent it is |
| IEC ratio method | Uses ratios such as C2H2/C2H4, CH4/H2 and C2H4/C2H6 | Classifying fault type |
| Duval Triangles and Pentagons | Plot relative gas proportions on graphical fault zones | Distinguishing PD, discharges and thermal faults of different severity |
| CO2/CO ratio | Indicates whether cellulose insulation is involved | Assessing paper degradation |
Continuous monitoring adds something laboratory sampling cannot: high-resolution rates of change and correlation with load and temperature. See transformer online DGA monitoring and our comparison of online DGA and oil sampling.
Trend and Correlation Analysis
Many important signals are not absolute values but changes and relationships:
- Gas generation that follows load points to a thermal fault, such as a poor joint or circulating current.
- Gas generation independent of load may point to a discharge or core grounding problem.
- Rising moisture in oil during heating shows water migrating out of the paper, revealing wet solid insulation.
- Hot-spot temperatures above the model's prediction indicate cooling degradation or a winding problem.
- Simultaneous changes in PD and bushing tan delta strongly suggest active insulation damage.
Machine Learning and Digital Twins
Data-driven methods such as anomaly detection and pattern recognition are increasingly used to flag unusual behavior that rule-based limits might miss. They work best as a complement to physics-based models and standards, not a replacement. Models trained on limited failure data can produce confident but wrong results, so experienced engineers should review their findings. A digital twin, which combines a thermal model, design data and live measurements, can compare expected and actual behavior continuously and highlight deviations.
For more on how individual monitoring methods contribute, see our guides to transformer condition monitoring methods et partial discharge monitoring.
Layer 4: Condition Assessment and Health Index
The final layer combines all diagnoses into a single, understandable view of each transformer. The most common tool is a health index (HI): a score that summarizes overall condition so that transformers can be compared and ranked across a fleet. Guidance such as CIGRE technical brochures on transformer condition assessment describes the general approach, although each utility adapts it to its own data and priorities.
How a Health Index Is Built
- Score each condition factor. For example, DGA, oil quality, moisture, paper condition, bushing condition, OLTC condition, thermal history and service record are each graded on a simple scale based on defined criteria.
- Weight the factors. Factors that indicate severe or irreversible damage, such as active arcing gases or advanced paper aging, receive higher weights than easily corrected issues such as a saturated breather.
- Combine the scores. A weighted sum or a rule-based approach produces an overall index. Many schemes also apply an override so that one critical finding sets the overall score to poor regardless of the others.
- Map to condition categories. The index is translated into bands that operators understand.
| Condition Category | Typical Interpretation | Typical Action |
|---|---|---|
| Good | No significant deterioration, normal aging | Continue normal monitoring |
| Fair | Minor deterioration or isolated findings | Increase monitoring attention, plan minor maintenance |
| Poor | Significant deterioration in one or more subsystems | Detailed diagnostics, plan repair or refurbishment |
| Very poor | Serious defects or advanced aging, elevated failure risk | Urgent investigation, restrict loading, plan replacement |
Paper Condition and Remaining Life
Paper condition is the factor that ultimately limits transformer life, because aged paper cannot be restored. The degree of polymerization (DP) of new paper is typically around 1,000 to 1,200 and falls as cellulose chains break down. A DP of around 200 is commonly regarded as end of life for the mechanical strength of the paper. DP cannot be measured online, so health systems estimate paper condition by combining:
- Cumulative loss of life calculated from hot-spot temperature history
- Furan compounds (especially 2-furfuraldehyde) measured in laboratory oil samples
- CO and CO2 trends from online DGA
- Moisture in paper estimated from moisture-in-oil and temperature data
Using several independent indicators gives a more reliable remaining-life estimate than any one of them alone.
From Health Index to Maintenance Decisions
Health alone does not decide priorities. A poor-condition transformer feeding a rural load with a spare on site may be less urgent than a fair-condition transformer supplying a hospital or a large generating unit. That is why mature asset management combines health with consequence:
Risk = Probability of failure (from health index) × Consequence of failure
Consequence considers factors such as customers affected, replacement lead time, safety, environmental impact and financial penalties. Plotting transformers on a health-versus-criticality matrix helps planners decide where to focus.
| Finding | Typical Response |
|---|---|
| Accelerated aging during peaks | Adjust load sharing, upgrade cooling, review cooling control settings |
| Rising moisture in insulation | Repair seals, replace breather, apply online drying or oil processing |
| Active thermal fault gases | Increase DGA frequency, investigate connections and core grounding, plan internal inspection |
| Détérioration des bagues | Confirm with offline tests, schedule bushing replacement |
| OLTC contact wear | Schedule OLTC maintenance based on condition rather than fixed operation counts |
| Advanced paper aging | Limit overloading, plan replacement or major refurbishment |
Many of these findings relate to common failure mechanisms described in our transformer failure modes guide and our transformer overheating guide.
Oil-Immersed vs Dry-Type Transformer Health Monitoring
The four-layer approach applies to both transformer types, but the parameters differ.
| Aspect | Transformateurs à huile | Transformateurs à sec |
|---|---|---|
| Main thermal measurement | Winding hot spot and oil temperatures | Winding and core temperatures |
| Chemical diagnostics | DGA, moisture, furans | Not applicable |
| Insulation diagnostics | PD, bushings, oil quality | PD, surface condition, insulation resistance |
| Environmental factors | Oil preservation, breathers, leaks | Dust, humidity, ventilation, condensation |
| Applications typiques | Grid, generation and large industrial transformers | Buildings, data centers, rail transit, renewable plants |
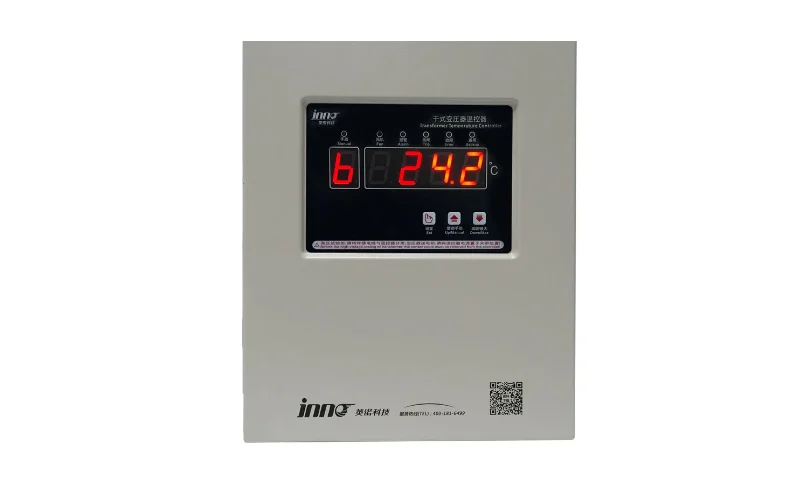
For oil-immersed units, see our oil-immersed transformer monitoring application. For dry-type units, an intelligent online health monitoring system for dry-type transformers or the YN-XP502F-3T intelligent monitoring device combines temperature, fan control and condition data in one unit. More details are on our dry-type transformer temperature monitoring page.
Implementation Roadmap
Health monitoring programs succeed when they start focused and grow based on proven value. A practical roadmap looks like this:
- Assess the fleet. Rank transformers by criticality and known condition to decide where monitoring delivers the most value.
- Define objectives. Agree whether the priority is fault detection, loading capability, life extension or investment planning.
- Select parameters and sensors. Match the monitoring scope to each transformer's tier. Specify direct hot-spot sensors for new critical units at the purchasing stage.
- Design data flow. Plan acquisition, communication protocols, storage, time synchronization and cybersecurity.
- Establish baselines. Record offline test results at commissioning and allow a learning period before finalizing alarm thresholds.
- Configure analytics and the health index. Start with standards-based methods and clear scoring rules that engineers can audit.
- Define response procedures. Assign owners and actions to alarms and health categories.
- Review and refine. Validate findings against inspections and failure investigations, then adjust weights and thresholds.
FAQ
What is the difference between transformer monitoring and health monitoring?
Monitoring collects and displays measurements and raises alarms on limits. Health monitoring goes further by interpreting the data, estimating aging and remaining life, and combining multiple indicators into an overall condition assessment that supports maintenance and investment decisions.
Which parameter is most important for transformer health?
No single parameter is sufficient, but winding hot-spot temperature and dissolved gases are usually the two most valuable. Hot spot governs insulation aging, while DGA reveals most types of internal faults.
Can a health index predict exactly when a transformer will fail?
No. A health index estimates relative condition and failure likelihood, which is very useful for ranking and planning, but it cannot predict an exact failure date. Sudden events such as through-faults or lightning can cause failures in otherwise healthy units.
Do I need online monitoring to calculate a health index?
A health index can be built from periodic offline tests alone. Online monitoring makes it more accurate and timely by providing continuous thermal history, high-resolution gas trends and early warning of fast-developing faults.
Can health monitoring be added to existing transformers?
Yes. Online DGA, bushing, PD, OLTC, oil level and pressure monitoring can all be retrofitted. Direct winding hot-spot sensors normally require access to the active part, so they are best installed on new transformers or during major refurbishment.
Build a Health Monitoring System for Your Transformers
From fiber optic hot-spot sensing to DGA, bushing, PD and OLTC monitoring, we supply the sensing and data layers that make reliable condition assessment possible. Our engineers support projects for power grid utilities, power generation, renewable energy, rail transit et substations, as well as surveillance des transformateurs de puissance applications.
Explore our fiber optic temperature monitoring et dissolved gas analysis solutions, review our certifications, or contact our team to discuss a health monitoring system for your fleet.