
Transformer Bushing Monitoring: Failure Indicators, Capacitance, Tan Delta & Leakage Current
Дата публикации:2026年9月25日 16:29:29
Bushings are small compared with the transformer they serve, yet they are responsible for a disproportionate share of major transformer failures. A bushing carries full line voltage through the grounded tank wall, and when its insulation breaks down the result is often a flashover, an oil fire or a tank rupture rather than a gradual loss of performance. That is why bushing condition has become a core part of any transformer monitoring program.
This guide explains how high-voltage condenser bushings deteriorate, which indicators reveal that deterioration early, and how capacitance, tan delta (dissipation factor) and leakage current are measured both offline and online. It also covers how to set practical alarm thresholds and how bushing data fits into a wider condition monitoring strategy.
Table of Contents
- Why Transformer Bushings Matter and Why They Fail
- How a Condenser Bushing Works
- Key Bushing Failure Indicators
- Capacitance (C1) Monitoring
- Tan Delta / Dissipation Factor Monitoring
- Leakage Current Monitoring
- Offline Testing vs Online Bushing Monitoring
- Online Bushing Monitoring System Architecture
- Alarm Thresholds and Trend Interpretation
- Integrating Bushing Data with DGA, PD and Temperature Monitoring
- Типичные области применения
- Часто задаваемые вопросы
Why Transformer Bushings Matter and Why They Fail
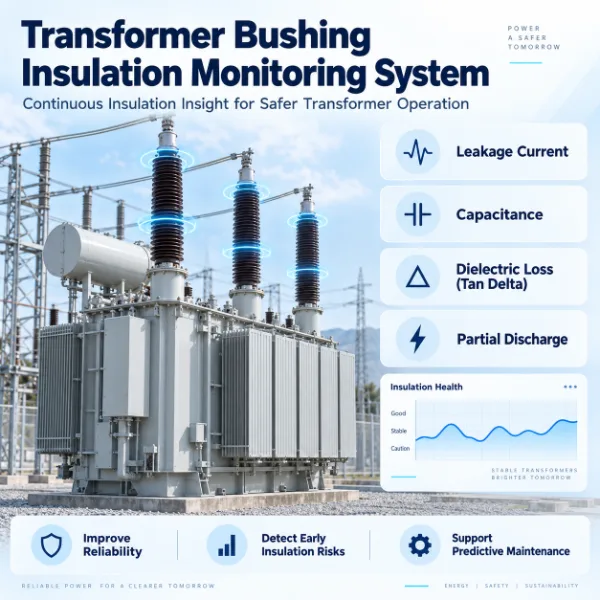
Industry failure surveys consistently place bushings among the top contributors to transformer outages, alongside windings and on-load tap changers. More importantly, bushing failures tend to be violent. A breakdown inside an oil-impregnated paper (OIP) bushing can ignite the bushing's own oil and the main tank oil, spreading damage to neighboring equipment in the substation.
The most common root causes are:
- Moisture ingress through aged gaskets, cracked porcelain or faulty oil-level sight glasses. Moisture raises dielectric losses and accelerates paper aging.
- Thermal aging of the paper insulation, especially where the bushing conductor runs hot because of poor connections or overloading. Our guide on transformer overheating causes and prevention covers the thermal side in more detail.
- Частичный разряд between condenser layers, often starting at manufacturing defects, voids or wrinkled foils.
- Oil leakage and low oil level in OIP bushings, which exposes the upper part of the condenser core.
- Test tap problems, including loose or corroded tap covers. An ungrounded test tap floats to a high voltage and can flash over internally.
- Overvoltages from lightning and switching surges that stress already weakened insulation.
- Механическая нагрузка from heavy line conductors, seismic events or short-circuit forces.
For a broader view of how these issues relate to other transformer defects, see our transformer failure modes guide.
How a Condenser Bushing Works
Most bushings rated above roughly 72.5 kV are condenser (capacitance-graded) bushings. The central conductor is wrapped with insulating layers, either oil-impregnated paper (OIP), resin-impregnated paper (RIP) or resin-impregnated synthetic material (RIS). Conductive foils are inserted at defined intervals, forming a series chain of concentric capacitors that distributes the electric field evenly between the conductor and the grounded flange.
Two capacitances matter for diagnostics:
- C1 is the main insulation capacitance between the conductor and the test tap (the last foil layer). It represents the health of the condenser core.
- C2 is the capacitance between the test tap and the grounded flange. It is typically several times larger than C1 and mainly reflects the tap insulation.
In service, the test tap is grounded through its cover. For testing, and for permanent online monitoring, a tap adapter connects the tap to a measuring circuit so that the current flowing through C1 can be measured continuously.
| Bushing Type | Изоляция | Typical Tan Delta When New (20 °C) | Main Aging Concerns |
|---|---|---|---|
| OIP | Kraft paper impregnated with mineral oil | About 0.2% to 0.4% | Moisture, oil leaks, gas generation, low oil level |
| RIP | Paper impregnated with epoxy resin | About 0.3% to 0.5% | Moisture absorption at the surface, voids, delamination |
| RIS | Synthetic fabric impregnated with resin | Low and stable | Manufacturing voids, partial discharge |
Values are typical guidance only. Always compare against the nameplate and factory test report of the specific bushing.
Key Bushing Failure Indicators
No single parameter captures every failure mechanism. Effective bushing diagnostics combine several indicators, each sensitive to different defects:
| Indicator | What It Reveals | Typical Measurement |
|---|---|---|
| Capacitance (C1) change | Short-circuited condenser layers, partial breakdown of the core | Offline bridge test or online tap current |
| Tan delta / power factor | Moisture, contamination, thermal aging of insulation | Offline bridge test or online phase comparison |
| Leakage current magnitude and phase | Combined effect of capacitance and loss changes | Continuous online measurement at the test tap |
| Частичный разряд | Voids, foil defects, surface tracking | Tap-coupled PD sensors, UHF or acoustic sensors |
| Temperature and hot spots | Poor terminal connections, excessive dielectric losses | Infrared thermography, contact or fiber optic sensors |
| Oil level and pressure (OIP) | Leaks, internal gassing | Sight glass inspection, pressure or level sensors |
Capacitance, tan delta and leakage current are the three electrical indicators that can be monitored continuously through the test tap, which is why they form the backbone of any bushing monitoring solution.
Capacitance (C1) Monitoring
Why Capacitance Changes
Because the condenser core is a chain of capacitors in series, the total C1 depends on the number of intact layers. When a breakdown short-circuits one layer, the remaining layers share the voltage and the total capacitance rises. If a bushing has n roughly equal layers and one of them shorts, C1 increases by approximately 1/(n−1). For a bushing with 20 layers, a single shorted layer raises C1 by about 5%.
This makes capacitance a direct indicator of progressive core breakdown. It is also a warning sign that the remaining layers are now carrying higher stress, which can lead to a cascading failure.
Interpreting Capacitance Data
- Compare the measured C1 with the nameplate value and the factory test result.
- Compare with previous tests on the same bushing. Trends are more informative than single readings.
- Compare with bushings of the same type on other phases of the same transformer.
- A capacitance decrease can indicate a floating or poorly connected foil, a problem at the test tap, or very low oil level in some designs.
Common utility practice, reflected in guidance such as IEEE C57.152, treats a C1 change of a few percent as a reason for closer investigation and a change around 10% as grounds for removing the bushing from service. Manufacturer recommendations should always take precedence where they are available.
Tan Delta / Dissipation Factor Monitoring
What Tan Delta Measures
An ideal insulation behaves as a pure capacitor, with current leading voltage by exactly 90°. Real insulation has resistive losses, so the current leads by slightly less than 90°. The small angle δ between the actual current and the ideal capacitive current is the loss angle, and:
tan δ = IR / IC
where IR is the resistive (loss) component and IC is the capacitive component. Power factor (cos φ) is closely related and, at the low values found in healthy insulation, is almost numerically equal to tan delta. North American test practice usually reports power factor, while IEC-based practice reports dissipation factor.
What Raises Tan Delta
- Moisture in the paper insulation, which is the most common cause
- Oil contamination and oxidation products
- Thermal aging of the cellulose
- Surface contamination or moisture on the external porcelain or composite housing
- Carbon tracking from partial discharge activity
Temperature Effects
Tan delta depends on insulation temperature, and the relationship differs between bushing types and between healthy and wet insulation. Offline results are normally corrected to 20 °C using manufacturer or standard correction factors. A tan delta that rises steeply with temperature is itself a warning sign of moisture. Online systems should record ambient temperature and, where possible, top-oil temperature so that trends can be interpreted correctly.
Practical Tan Delta Guidance
- A value that has doubled compared with the nameplate or first baseline measurement warrants investigation, even if the absolute number still looks low.
- For OIP bushings, values above about 0.5% (corrected to 20 °C) are commonly treated as a warning, and values approaching 1% as serious.
- Sudden step changes are more worrying than slow drift, because they suggest an active defect rather than normal aging.
Leakage Current Monitoring
The Current Through C1
In service, the current flowing through the main insulation to the test tap is set by the phase voltage and the C1 capacitance:
I = U × 2πf × C1
For example, a 550 kV bushing with C1 of 500 pF on a 50 Hz system at about 318 kV phase-to-ground voltage carries roughly 50 mA of tap current. This current contains both a capacitive component and a small resistive component, so its magnitude tracks capacitance and its phase angle tracks tan delta.
Online Measurement Methods
Because the system voltage is not always available as a precise reference, online monitors use several approaches:
- Sum current method. The tap currents of the three bushings on one winding are added vectorially. With healthy, identical bushings on a balanced system the sum is small and stable. A change in C1 or tan delta on any one bushing shifts the sum vector, and the direction of the shift points to the affected phase.
- Reference voltage method. The tap current is compared with a voltage signal from a voltage transformer (VT) on the same phase, giving an absolute measurement of capacitance and loss angle.
- Reference bushing method. Two bushings on the same phase, for example on parallel transformers, are compared with each other. Because both see the same voltage, system fluctuations cancel out and relative changes stand out clearly.
Each method has trade-offs in sensitivity and immunity to system unbalance, voltage variations and temperature differences. Many modern systems combine them to reduce false alarms.
Offline Testing vs Online Bushing Monitoring
| Aspect | Offline Testing | Онлайн-мониторинг |
|---|---|---|
| Outage required | Да | No |
| Test frequency | Typically every 1 to 6 years | Continuous, with readings every few minutes |
| Test voltage | Usually 10 kV or less | Full operating voltage |
| Accuracy of single reading | Very high under controlled conditions | Good, affected by system conditions |
| Detection of fast-developing faults | Poor, defects can develop between tests | Good, trends and step changes captured |
| Additional diagnostics | Frequency-domain spectroscopy, tip-up tests | Correlation with load, temperature and weather |
The two approaches complement each other. Offline tests provide accurate baselines and detailed diagnostics, while online monitoring catches defects that develop in the months or years between planned outages. A similar logic applies to oil analysis, as explained in our comparison of online DGA versus periodic oil sampling.
Online Bushing Monitoring System Architecture
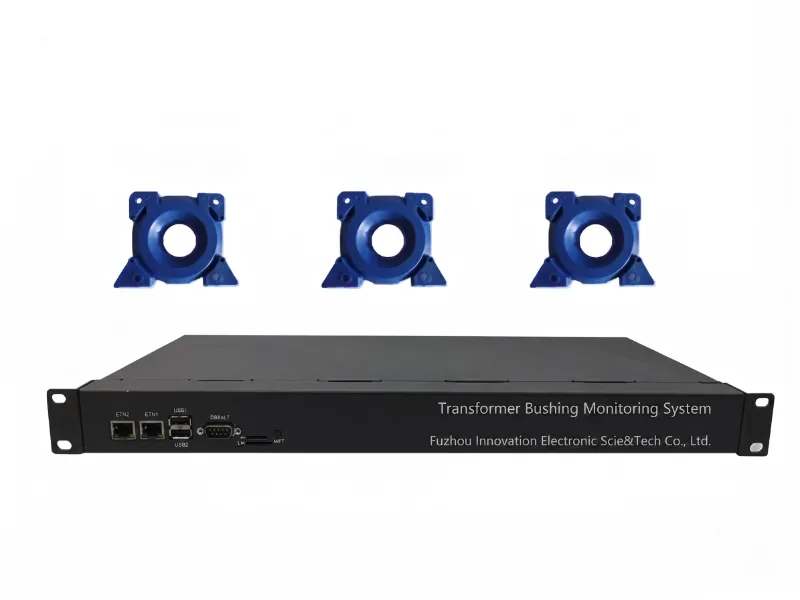
A typical система мониторинга проходных муфт трансформатора includes the following components:
- Test tap adapters. These replace the standard tap covers and connect the tap to the measuring circuit. A well-designed adapter keeps the tap safely grounded through protective components even if the signal cable is damaged, because an open test tap can rise to dangerous voltages and cause internal flashover.
- Surge protection. Protective devices limit transient overvoltages from lightning and switching so that neither the bushing tap nor the electronics are damaged.
- Signal acquisition unit. Usually mounted on or near the transformer, it digitizes tap currents and reference signals with high resolution and synchronizes the channels.
- Processing and analysis. Software calculates capacitance, tan delta and leakage current, applies temperature compensation and filters out system disturbances.
- Communication. Results are passed to substation automation systems via protocols such as IEC 61850, Modbus or DNP3, and to asset management platforms for fleet-wide analysis.
Many installations also use the same tap connection to pick up partial discharge signals, which adds an important diagnostic layer. See our guide to partial discharge monitoring in transformers for detection methods and sensor choices.
Installation Considerations
- Confirm the test tap design and thread type for each bushing model before ordering adapters.
- Record baseline offline C1 and tan delta values immediately before commissioning the online system.
- Allow a learning period of several weeks so the system can establish normal variation with load and temperature.
- Route signal cables away from high-current conductors and ground cable shields correctly to avoid interference.
Alarm Thresholds and Trend Interpretation
Alarm settings should reflect the bushing type, its baseline and the owner's risk tolerance. The table below shows a commonly used starting point. It is intended as general guidance, not a replacement for manufacturer limits or applicable standards such as IEC 60137, IEEE C57.19.01 and IEEE C57.152.
| Параметр | Normal | Warning | Сигнализация |
|---|---|---|---|
| C1 change from baseline | Below about 3% | About 3% to 5% | Above about 5%, with removal usually considered near 10% |
| Tan delta change from baseline | Stable, below about 1.5 times baseline | About 1.5 to 2 times baseline | More than 2 times baseline or a rapid rise |
| Sum current (three-phase) | Stable within learned band | Gradual drift outside learned band | Step change or sustained rapid drift |
| Rate of change | Negligible over months | Noticeable change over weeks | Significant change over days or hours |
When interpreting trends, keep these points in mind:
- Rate of change matters more than absolute value. A bushing that has been slightly high but stable for years is usually less urgent than one that has moved quickly from a good value.
- Look at all three phases together. If all bushings drift in the same direction at the same time, the cause is more likely system voltage, temperature or weather than a bushing defect.
- Watch for weather effects. Rain, fog and surface contamination can temporarily change external leakage currents, especially on porcelain housings.
- Confirm before acting. A significant online alarm should normally be followed by an offline test, infrared inspection and, for OIP bushings, oil sampling where the design permits.
Integrating Bushing Data with DGA, PD and Temperature Monitoring
Bushing monitoring is most valuable when it is part of a complete picture of transformer health. Different sensors confirm or rule out each other's findings:
- Dissolved gas analysis. Rising hydrogen or acetylene in the main tank can come from an internal bushing fault at the lower end of the bushing. Combining bushing data with online DGA monitoring helps locate the source. Learn more about our dissolved gas analysis solutions.
- Partial discharge. PD activity together with a rising tan delta strongly suggests active insulation damage. Our partial discharge monitoring solutions can share the bushing tap connection.
- Temperature. Top-oil and winding temperatures are needed to compensate tan delta and to separate load effects from real deterioration. Direct fiber optic temperature monitoring gives accurate hot-spot data, and our article on high-voltage temperature measurement explains why fiber optic sensing is well suited to energized components.
- Oil level and pressure. A transformer oil temperature, level and pressure monitoring system helps detect leaks and gassing that may accompany bushing problems.
- Tap changer. OLTC faults can produce gas signatures that overlap with bushing faults, so Мониторинг OLTC helps avoid misdiagnosis.
For guidance on selecting which parameters to monitor and how to prioritize them, see our overview of transformer condition monitoring methods and strategy, as well as our transformer insulation monitoring application page.
Типичные области применения
Online bushing monitoring is usually justified wherever a transformer failure would have high consequences or where bushings belong to a population with known problems:
- Transmission and grid transformers at 110 kV and above, where outages affect large areas. See our work for power grid utilities и substation transformer monitoring.
- Generator step-up transformers in power generation plants, where a bushing failure can take a generating unit offline for months.
- Collector and grid-connection transformers in renewable energy projects, which are often remote and lightly staffed.
- Critical industrial supplies in the oil and gas sector, where unplanned outages carry high safety and production costs.
- Aging fleets of power transformers и oil-immersed transformers fitted with OIP bushings approaching the end of their expected life.
Часто задаваемые вопросы
What is the difference between tan delta and power factor for bushings?
Tan delta is the ratio of resistive to capacitive current, while power factor is the cosine of the angle between voltage and current. For the low loss values of healthy bushing insulation, the two numbers are almost identical, so they are often used interchangeably. The key is to compare like with like and to use the same temperature correction basis.
Does an increase in capacitance always mean a bushing is failing?
Not always, but a sustained capacitance increase is one of the most reliable signs of shorted condenser layers. Small apparent changes can also come from measurement conditions, temperature or tap connection issues, which is why trending and confirmation testing are important.
Can online monitoring replace offline bushing tests?
Online monitoring reduces the need for frequent outages and catches fast-developing faults, but offline tests remain valuable for baselines, detailed diagnostics and confirming alarms. Most utilities use both.
Is it safe to connect a monitor to the bushing test tap?
Yes, provided a properly rated tap adapter with built-in protection is used. The adapter must keep the tap grounded if the measuring circuit fails, because an open test tap can develop a high voltage and damage the bushing.
How often do online systems measure bushing parameters?
Most systems measure continuously and store values at intervals of a few minutes, with faster capture triggered by events. This resolution is enough to separate daily load and temperature cycles from genuine deterioration.
Get Expert Support for Your Bushing Monitoring Project
Choosing the right bushing monitoring approach depends on bushing type, voltage level, existing sensors and communication infrastructure. Our engineers can help you define measurement points, alarm strategies and integration with your existing мониторинг температуры трансформатора and DGA systems. Browse our complete range of solutions, review our certifications, or visit the technical support page for documentation.
Ready to discuss your project? Contact our team for a tailored bushing monitoring proposal.