

Что такое диагностика трансформаторов?
Дата публикации:11 октября 2026 г., 15:26:36
- Transformer diagnostics is the process of using test results, monitoring data and fault indicators to judge the present condition of a power or distribution transformer and to narrow down the likely fault type or location.
- Diagnostic inputs include oil analysis, partial discharge signals, temperature data, bushing parameters, OLTC operating data, insulation measurements and winding electrical tests.
- Common methods include dissolved gas analysis (DGA), partial discharge detection, thermal assessment, bushing capacitance and dielectric loss evaluation, insulation resistance checks and frequency response analysis (SFRA).
- Online monitoring tracks in-service data and flags abnormal trends. Offline testing uses planned outages for controlled measurements that help confirm a suspected fault. The two approaches are complementary.
- Condition monitoring observes parameters and trends, while fault diagnosis interprets that evidence to explain what may be happening inside the transformer.
- A single measurement rarely supports a reliable conclusion. Gas patterns, temperature behavior, discharge activity and electrical test results should be evaluated together.
- Different methods suit different suspected faults: DGA for thermal and electrical faults in oil, PD detection for insulation defects, SFRA for winding deformation, and bushing data for bushing deterioration.
Содержание
- Diagnostic Principles and Transformer Fault Assessment
- Online Monitoring vs Offline Diagnostic Testing
- Dissolved Gas Analysis and Oil-Based Fault Diagnosis
- Partial Discharge and Insulation Defect Detection
- Winding Electrical Tests and Mechanical Deformation
- Thermal Assessment and Hot-Spot Detection
- Bushing and OLTC Condition Assessment
- Insulation Resistance, Moisture and Dielectric Condition
- Fault Indicators and Diagnostic Method Selection
- Combining Multiple Diagnostic Results
- INNOFZ Monitoring Options for Condition Assessment
- When Transformer Diagnostic Testing Is Needed
- Transformer Diagnostics FAQ
1. Diagnostic Principles and Transformer Fault Assessment
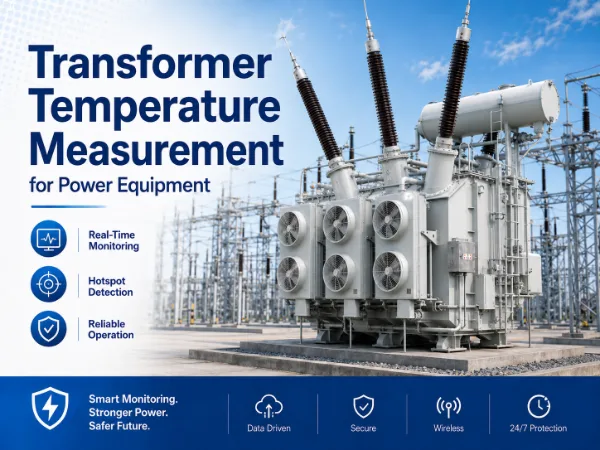
Transformer diagnostics combines measured data, test results and known fault signatures to explain why a transformer is behaving a certain way. The output is a technical judgment: whether the unit is in normal condition, whether an abnormal indication is developing, and which part of the transformer is most likely involved.
Evidence typically comes from operating data, measured parameters, trend history, electrical tests, oil analysis, insulation tests, mechanical tests and thermal measurements. Each source answers a different question, so the combination matters more than any single result.
1.1 What Does Transformer Diagnosis Mean?
Diagnosis starts from an observation, such as a gas increase, a temperature deviation or a change in a test signature, and works toward a possible cause. Condition assessment is broader. It summarizes overall transformer health for maintenance and replacement planning, and diagnosis supports it by explaining specific abnormal indications.
1.2 Fault Detection vs Fault Diagnosis
Fault detection answers whether something abnormal is present. Fault diagnosis goes further and asks what type of abnormality it is, where it may be located and how serious it appears.
An alarm from an online sensor is detection. Interpreting gas ratios, comparing winding test results and checking temperature behavior against loading moves the work toward diagnosis.
1.3 Why One Measurement Is Rarely Enough
Single parameters overlap across fault types. Temperature rise may come from heavy loading, reduced cooling or internal heating, and hydrogen in oil may be associated with partial discharge or with other decomposition processes.
Independent evidence from a second or third method narrows the possibilities. Cross-checking also helps separate real transformer behavior from sensor drift, wiring problems or measurement conditions.
| Term | Primary Purpose | Typical Data | Typical Result |
|---|---|---|---|
| Мониторинг состояния | Observe operating parameters and trends over time | Temperature, load, gas concentration, PD level, bushing parameters | Trend records, alarms, indication of change from baseline |
| Fault Detection | Recognize that an abnormal condition exists | Threshold crossings, rate-of-change alerts, protection or alarm signals | Abnormal-condition flag, request for further review |
| Fault Diagnosis | Identify likely fault type, location or mechanism | Gas ratios, PD patterns, test signatures, combined parameter behavior | Probable fault category with supporting evidence |
| Diagnostic Testing | Obtain controlled measurements to confirm or rule out a suspected fault | Winding tests, SFRA, insulation tests, offline PD measurement, oil laboratory results | Confirmation, refined diagnosis or maintenance recommendation |
2. Online Monitoring vs Offline Diagnostic Testing
Online monitoring and offline diagnostic testing answer different questions at different points in the transformer life cycle. Treating one as a replacement for the other leaves gaps in the evidence.
2.1 Online Monitoring During Service
Online monitoring collects data continuously while the transformer remains energized. Its strength is trend focus: gradual drift, step changes and repeated events become visible between planned outages, which supports early detection of abnormal conditions.
Непрерывный мониторинг состояния трансформатора provides trend information that can trigger further diagnostic testing, but monitored values alone seldom confirm a specific fault mechanism.
2.2 Offline Diagnostic Testing
Offline diagnostics are planned measurements made during commissioning, outages or fault investigations. Test conditions are controlled, connections are known and results can be compared with factory data, earlier tests or sister units.
Such tests provide detailed evidence for fault confirmation, although each result describes the transformer at one point in time.
2.3 How the Two Approaches Work Together
Online data indicates when and where attention is needed. Offline tests then provide the controlled measurements that support a confident diagnosis. After repairs or maintenance, offline results also reset baselines that online alarm settings depend on.
| Aspect | Онлайн-мониторинг | Offline Diagnostic Testing |
|---|---|---|
| Operating State | Transformer energized and in service | Usually de-energized or isolated, depending on the test |
| Data Frequency | Continuous or repeated at short intervals | Periodic or event-driven, at planned times |
| Основная цель | Early abnormal-condition detection and trend tracking | Detailed fault confirmation and baseline measurement |
| Typical Methods | Online DGA, PD monitoring, temperature, bushing, OLTC and oil parameters | Winding resistance, turns ratio, SFRA, insulation tests, offline PD measurement, laboratory oil analysis |
| Преимущества | No outage required; captures changes between tests; supports alarm response | Controlled conditions; wider range of tests; comparison with reference data |
| Limitations | Sensor coverage is limited; interference and operating variation affect interpretation | Needs an outage or test window; faults can develop between tests |
| Типичные области применения | Critical, aging or remote transformers where trends matter | Commissioning, planned maintenance, alarm follow-up, post-fault investigation |
3. Dissolved Gas Analysis and Oil-Based Fault Diagnosis
DGA is one diagnostic method among several, and it should not be treated as the whole of transformer diagnosis. Its value lies in showing that decomposition of oil or cellulose is taking place and in suggesting what kind of energy is involved.
3.1 Oil Sampling and Online DGA
Laboratory analysis of oil samples remains a reference method in many maintenance programs, and dissolved gas analysis in transformers relies on key gases, ratios and rates of change to classify fault types. Sampling intervals, however, leave periods in which a fast-developing fault goes unobserved.
Automated online DGA monitoring for transformers shortens the interval between measurements and records gas trends continuously. Laboratory results are still useful for cross-checking an online alarm.
3.2 Fault Gases and Ratio Interpretation
Gas concentrations are interpreted through published guidance such as IEC 60599 and IEEE C57.104, which describe key-gas and ratio approaches. Alarm limits and condition categories should come from those documents, the owner's practice and the transformer's own history rather than from generic numbers.
| Oil / Gas Indicator | Diagnostic Value | Possible Condition | Limitations |
|---|---|---|---|
| Водород (H₂) | Sensitive early indicator of energy-related decomposition | Can be associated with partial discharge and with several other fault types | Present in many conditions; not specific on its own |
| Methane and ethane (CH4, C2H6) | Indicate thermal decomposition of oil | May indicate lower-temperature thermal faults | Interpretation depends on the other gases present |
| Этилен (C₂H₄) | Indicates higher-temperature oil decomposition | May indicate more severe thermal faults | Needs support from ratios, trend and loading information |
| Ацетилен (C₂H₂) | Associated with high-energy electrical discharge | May indicate arcing; requires confirmation | Normal in arcing-in-oil OLTC diverter switches; leakage from an OLTC compartment can confuse main-tank results |
| Carbon monoxide and carbon dioxide (CO, CO2) | Indicate decomposition of cellulose insulation | Can be associated with paper overheating or ageing | Normal ageing also produces these gases; depends on transformer design and preservation system |
| Rate of gas increase | Shows whether a condition is static or developing | Faster growth can suggest an active fault | Needs consistent sampling or monitoring intervals and a known history |
3.3 Rate of Change and Trend
Rate of change often matters more than a single concentration. A stable elevated value can reflect an old, stabilized condition, while a rising trend on a low absolute level can indicate a new one.
Trend interpretation needs the transformer's history, including load events, oil treatment, maintenance and any OLTC operation counts.
3.4 Limits of Oil-Based Diagnosis
DGA does not locate a fault precisely, and it cannot see mechanical deformation or loose connections that produce no gas. Gas results also depend on oil circulation, sampling point and, in some designs, gas exchange with the OLTC compartment.
Oil-based findings should therefore be matched with thermal, electrical and mechanical evidence before conclusions are drawn.
4. Partial Discharge and Insulation Defect Detection
Partial discharge activity can point to insulation defects such as voids, surface discharge, floating potentials or poor contacts. PD detection supports insulation assessment, and PD patterns and trends add detail that gas analysis alone does not provide.
4.1 Detection Methods Used for PD
Several sensing methods are used in practice, each with its own coverage and sensitivity to interference. Methods are often combined to cross-check a suspected source, and мониторинг частичных разрядов в трансформаторах covers the detection methods and sensors in more detail.
| PD Method | Signal Detected | Typical Position | Limitation |
|---|---|---|---|
| UHF | Ultra-high-frequency electromagnetic signals from internal discharge | Oil valve or tank interface | Needs suitable access to the tank interior; interference from external sources must be considered |
| HFCT | High-frequency pulse current on conductors | Grounding cable or bushing ground path | Picks up external pulses as well; source location is limited |
| Ultrasonic | Acoustic emission from discharge activity | Tank surface | Signal paths through oil, paper and structure affect detection |
| Conventional electrical PD measurement | Apparent charge during a controlled test, commonly following IEC 60270 practice | Bushing taps during an offline test | Needs de-energized test conditions and suitable test equipment |
4.2 Online PD Monitoring vs Offline PD Testing
Online PD monitoring is not the same thing as offline PD diagnostic testing. Online systems track discharge activity during operation, producing trends, alarms and pattern views such as PRPD and PRPS, and the INNOFZ PD monitoring system is an online monitoring system of this type.
Offline PD testing is carried out under controlled test conditions, typically during factory acceptance, commissioning or planned maintenance. It gives a snapshot under defined test voltage and is often used to confirm findings from online data.
4.3 External Interference and Interpretation
Substations contain corona, switching pulses, radio interference and other noise sources that can resemble PD. Sensor channel comparison, filtering, pattern review and trend consistency help separate internal discharge from interference.
Findings should be matched with DGA, particularly hydrogen behavior, and with insulation tests before a conclusion about an internal defect is reached.
5. Winding Electrical Tests and Mechanical Deformation
Winding electrical tests are mostly offline diagnostics. They evaluate resistance, ratio, magnetizing behavior, impedance and frequency response, and they are used when winding, core, connection or tap changer problems are suspected.
5.1 Common Winding and Core Tests
Winding resistance measurements check connection quality and conductor continuity. Turns ratio and excitation current tests help evaluate winding turns and magnetic circuit behavior, while short-circuit impedance and leakage reactance relate to winding geometry.
| Diagnostic Test | What It Evaluates | Possible Fault Indication | Online / Offline |
|---|---|---|---|
| Winding resistance | DC resistance of windings, leads and tap changer contacts | Can suggest poor contacts, high-resistance connections or conductor problems | Offline |
| Transformer turns ratio | Voltage ratio at each tap position | May indicate turn-to-turn problems or tap changer and connection issues | Offline |
| Excitation current | Magnetizing characteristics of core and windings | Can be associated with core problems or winding turn faults | Offline |
| Short-circuit impedance / leakage reactance | Winding geometry and leakage flux path | May indicate winding displacement or deformation | Offline |
| Frequency response analysis (SFRA) | Frequency response signature of windings and core structure | Can suggest winding movement, deformation or core and clamping changes | Offline |
5.2 SFRA and Mechanical Deformation
SFRA compares response traces against a reference, which may be a factory baseline, another phase or a sister unit. Differences in particular frequency ranges can be associated with winding displacement or core structure changes, and measurement and interpretation guidance exists in IEC 60076-18 and IEEE C57.149.
Acceptance criteria are not universal, and results depend on transformer design, test setup and grounding practice. Interpretation is usually combined with fault history, such as a recent through-fault or transport event.
5.3 Limits of Offline Electrical Tests
Offline tests need an outage and show the transformer as it was at the time of measurement. A passing result on one test does not exclude faults that other methods are better suited to detect, such as a developing PD source or a thermal problem under load.
6. Thermal Assessment and Hot-Spot Detection
Thermal data can reveal abnormal conditions early, since many faults and operating problems produce heat. Diagnosis still requires loading, cooling and oil information, because temperature alone has several possible explanations.
6.1 Temperature Measurements Used in Assessment
| Thermal Indicator | What It Shows | Diagnostic Use | Caveat |
|---|---|---|---|
| Максимальная температура масла | Bulk oil condition in the upper tank | Reference for loading and cooling behavior | Reflects average conditions rather than local hot spots |
| Температура намотки | Winding thermal condition, often derived from top-oil temperature and load current | Operational control and alarm indication | Indirect estimate; depends on calibration and thermal model assumptions |
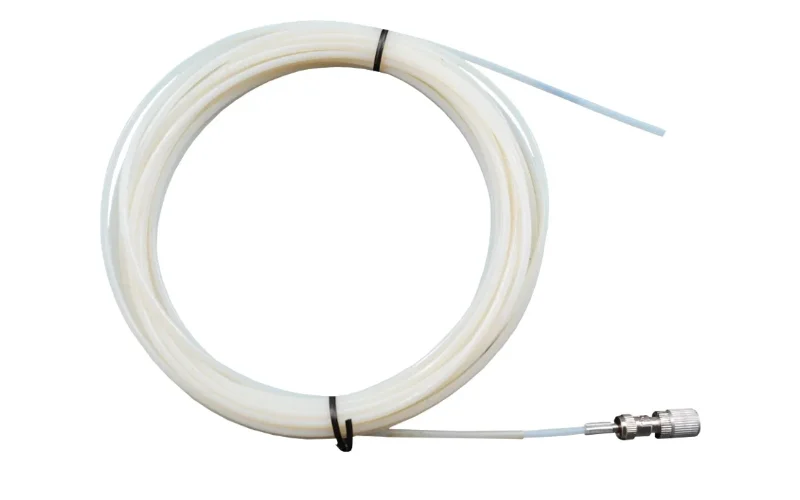
| Hot-spot temperature (direct) | Temperature at selected winding positions, for example through fiber optic probes | Direct evidence of local heating at measured points | Covers only the instrumented positions |
| Thermal imaging | Surface temperature of tank, radiators, bushings and external connections | Locating external hot spots and cooling anomalies | Cannot see internal winding temperature directly |
| Temperature rise versus load | Relationship between heating and current | Distinguishing load-driven heating from unexplained heating | Needs accurate load, ambient and cooling data |
6.2 Interpreting Thermal Data with Loading and Cooling
Temperature behavior is judged against load current, ambient temperature and cooling stage. Winding temperature rising faster than load would explain can suggest reduced cooling or internal heating, and Предельные значения нагрева трансформатора и номинальные характеристики provide the reference framework for what rise is expected under rated conditions.
Direct measurement of local heating, as described in winding hot-spot temperature measurement, gives stronger evidence than calculated values where fiber optic probes are installed. Continuous мониторинг температуры трансформатора also supplies the context needed to interpret DGA changes.
7. Bushing and OLTC Condition Assessment
Bushings and on-load tap changers are common sources of transformer problems, and each has diagnostic indicators that are largely separate from main-tank data. Their data is also useful for ruling out confusion with main-tank faults.
7.1 Bushing Electrical Condition
Bushing assessment relies on capacitance, dielectric loss (tan delta or power factor) and leakage current measured through the test tap. Baseline comparison is central: values are compared with nameplate or factory data, earlier results and the other phases of the same transformer.
Trends matter as much as absolute values, and step changes are generally more concerning than slow drift. Transformer bushing monitoring explains how capacitance, tan delta and leakage current behave as insulation deteriorates.
Offline bushing tests give accurate baselines during outages, while online monitoring tracks changes between outages. Confirming an online alarm usually involves offline tests, thermal inspection and other supporting evidence.
7.2 OLTC Mechanical and Electrical Condition
OLTC diagnosis uses motor current, vibration, temperature, torque and tap position. Changes in motor current or torque can be associated with increased friction or mechanical resistance, while vibration signatures reflect the timing and character of switching events.
Temperature difference between the OLTC compartment and the main tank is another useful indicator, and Мониторинг трансформаторов OLTC describes what to monitor in an on-load tap changer. OLTC oil gas patterns must be read differently from main-tank DGA, since arcing-in-oil designs normally generate some acetylene.
Online OLTC data indicates which units need attention first. Offline tests such as dynamic resistance measurement and internal inspection confirm the diagnosis.
| Component Parameter | Diagnostic Meaning | Possible Condition | Confirmation Approach |
|---|---|---|---|
| Bushing capacitance (C1) | Condition of the condenser core | Sustained increase can be associated with shorted layers; changes can also come from measurement issues | Offline capacitance test, comparison with other phases and baseline |
| Bushing tan delta | Dielectric loss in insulation | May indicate moisture, contamination or ageing | Offline test with temperature correction, trend review |
| Bushing leakage current | Combined effect of capacitance and loss changes | Drift can suggest insulation change in one bushing | Phase comparison, offline test, thermal inspection |
| OLTC motor current | Mechanical load during tap change | May indicate friction, binding or drive problems | Mechanism inspection, comparison with baseline curves |
| OLTC vibration | Timing and impact pattern of switching | Can suggest wear, loose parts or incomplete transitions | Dynamic resistance measurement, internal inspection |
| OLTC temperature and torque | Thermal condition and operating force | May indicate contact heating or increased resistance | OLTC oil analysis, inspection at planned maintenance |
8. Insulation Resistance, Moisture and Dielectric Condition
Insulation diagnostics cover a branch of the broader evidence picture. They focus on how well the oil and cellulose system retains its dielectric and ageing properties, and this section limits itself to the diagnostic role of those tests. The wider scope of online insulation tracking is covered in мониторинг изоляции трансформатора.
8.1 Insulation Resistance and Polarization Tests
Insulation resistance tests and polarization index measurements give an overall indication of insulation cleanliness and dryness. Results depend strongly on temperature and surface conditions, so interpretation uses the same transformer's history rather than fixed pass/fail numbers.
8.2 Moisture and Oil Condition
Moisture accelerates cellulose ageing and lowers dielectric strength. Moisture in oil is temperature dependent, so oil measurements are interpreted with oil temperature and, where possible, with estimates of moisture in paper, as outlined in transformer moisture monitoring.
Oil condition tests, such as breakdown voltage, acidity and dielectric dissipation factor, show how contamination and oxidation products affect the insulating liquid. A broader view of oil parameters appears in transformer oil health monitoring.
8.3 Dielectric Response and Insulation Ageing
Dielectric response methods and furan analysis provide additional evidence about moisture and paper ageing. These tests are specialized, and their results are generally interpreted by experienced engineers alongside DGA, oil tests and operating history.
9. Fault Indicators and Diagnostic Method Selection
Matching an observed condition to suitable diagnostic methods keeps testing efficient. Every row below lists possibilities rather than conclusions, and each indication may require confirmation. Background on how transformer failure modes, causes and symptoms develop is covered separately, so this section concentrates on which methods to apply.
9.1 Observed Conditions and Useful Methods
| Наблюдаемое состояние | Possible Causes | Useful Diagnostic Methods | Related Online Monitoring |
|---|---|---|---|
| Повышение температуры обмотки | May indicate higher loading, reduced cooling or internal heating | Load review, cooling system check, DGA, thermal imaging, winding resistance if an internal cause is suspected | Winding and top-oil temperature, fiber optic hot-spot temperature, load current |
| Abnormal DGA | Can be associated with thermal faults, partial discharge, arcing, cellulose decomposition or OLTC gas migration | Laboratory DGA confirmation, ratio and trend analysis, OLTC oil comparison, PD and winding tests as indicated | Online DGA gas trends and rate of change |
| Повышение активности PD | May indicate voids, surface discharge, floating potential or contact problems | UHF or acoustic PD localization, DGA review, offline PD measurement, insulation tests | Online PD monitoring with pattern and trend review |
| Oil level change | Can suggest leakage, thermal expansion effects, or leakage between compartments | Visual inspection, gauge verification, leak check, DGA and moisture review | Oil level and pressure monitoring where installed |
| Bushing parameter drift | May indicate moisture, ageing, shorted condenser layers, or tap and measurement issues | Offline capacitance and tan delta tests, thermal imaging, PD check, comparison with other phases | Online bushing parameter monitoring |
| OLTC vibration or current change | Can be associated with mechanical wear, friction, lubrication problems or contact issues | Dynamic resistance measurement, mechanism inspection, OLTC oil analysis | OLTC current, vibration, torque and temperature monitoring |
| Сбой системы охлаждения | May indicate fan or pump faults, control supply problems or blocked radiators | Cooling system functional check, thermal imaging, temperature rise versus load review | Fan and pump status, top-oil and winding temperature |
| Moisture increase | Can suggest seal or breather problems, ingress, or insulation ageing | Oil moisture analysis, insulation resistance, dielectric response, oil condition tests | Moisture-in-oil measurement with oil temperature |
| Unexpected temperature rise at normal load | Should be evaluated with loading data; possible causes include cooling problems, external hot spots or internal heating | Thermal imaging of connections and tank, DGA, winding resistance, cooling inspection | Multi-point temperature channels, load and ambient data |
9.2 Method Selection Logic
Selection normally follows three questions:
- Which subsystem is most likely involved: oil and insulation, windings, bushings, OLTC or cooling?
- Which method is sensitive to that kind of fault, and can it be performed with the transformer in service or only during an outage?
- Which second method can confirm or contradict the first result?
10. Combining Multiple Diagnostic Results
Single parameters are ambiguous, and multi-parameter assessment narrows the diagnostic range. Combined evidence also reduces false alarms caused by sensor issues or unusual operating conditions.
10.1 Common Combinations
| Combination | What It May Suggest | Follow-Up Evidence |
|---|---|---|
| High temperature + cooling failure | Heating may be driven by reduced heat removal rather than an internal fault | Cooling inspection, load review, temperature after cooling restoration |
| High temperature + abnormal DGA | Can be associated with an internal thermal condition | Gas ratios, winding resistance, thermal comparison with load |
| PD increase + bushing parameter change | May suggest insulation deterioration involving a bushing | Offline bushing tests, PD localization, DGA review |
| DGA change + stable temperature | Can indicate a non-thermal source such as discharge, or gas migration from another compartment | PD data, OLTC oil comparison, repeat sampling |
| OLTC vibration + motor current change | May indicate mechanical wear or increased friction in the tap changer | Dynamic resistance measurement, inspection, OLTC oil analysis |
10.2 Using Multi-Parameter Data
Data from several sensors in one view helps engineers see which signals moved together and which stayed stable. A решение для мониторинга трансформаторов that integrates DGA, temperature, PD, bushing and OLTC data makes that comparison more direct, though conclusions still depend on engineering judgment and, where needed, offline tests.
11. INNOFZ Monitoring Options for Condition Assessment
Online monitoring supplies the in-service data that diagnostic work relies on. INNOFZ lists several системы мониторинга трансформаторов that each provide a different diagnostic indicator.
11.1 Monitoring Options and Diagnostic Indicators
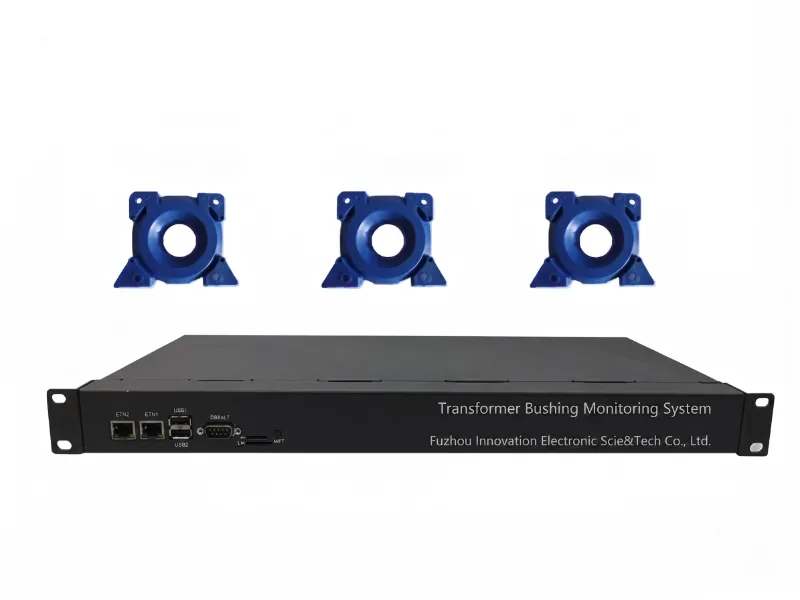
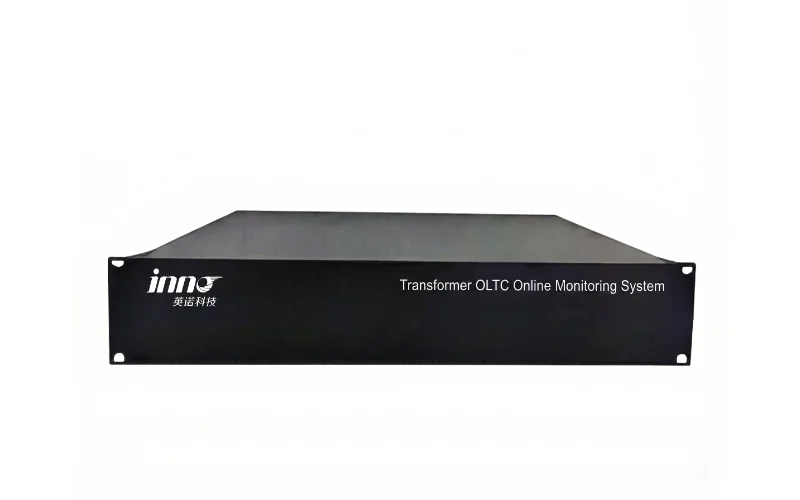
The following options are described in the product documentation: an онлайн-система мониторинга DGA трансформаторного масла, a Система онлайн-мониторинга частичных разрядов трансформатора, a система мониторинга втулок, a transformer OLTC online monitoring system и многоканальная оптоволоконная система измерения температуры.
| Monitoring Option | Primary Diagnostic Indicator | Online Data | Типичная область применения |
|---|---|---|---|
| Online DGA monitoring system | Dissolved fault gases in transformer oil | Seven gases (H2, CH4, C2H6, C2H4, C2H2, CO, CO2) by gas chromatography; adjustable cycle with a minimum of 2 hours or less; optional moisture-in-oil; MODBUS and IEC 61850 communication | Oil-immersed power transformers; live installation on energized transformers through existing oil valves |
| Partial discharge online monitoring system | PD activity and discharge patterns | Discharge magnitude, phase and 3D PRPD pattern; UHF, HFCT and ultrasonic sensor options; 4 or 6 channels; RJ45 Ethernet and RS485 | Power transformers in substations, power plants and industrial facilities |
| Bushing monitoring system | Bushing capacitance, tan delta and insulation condition changes | Capacitance and tan delta trends | Online bushing condition tracking on transformers |
| INNO-OLTC OLTC online monitoring system | OLTC mechanical and electrical operating condition | Current, temperature, vibration, torque and tap position; Modbus and DL/T860 communication | Power transformers, substations, generator step-up and industrial transformers |
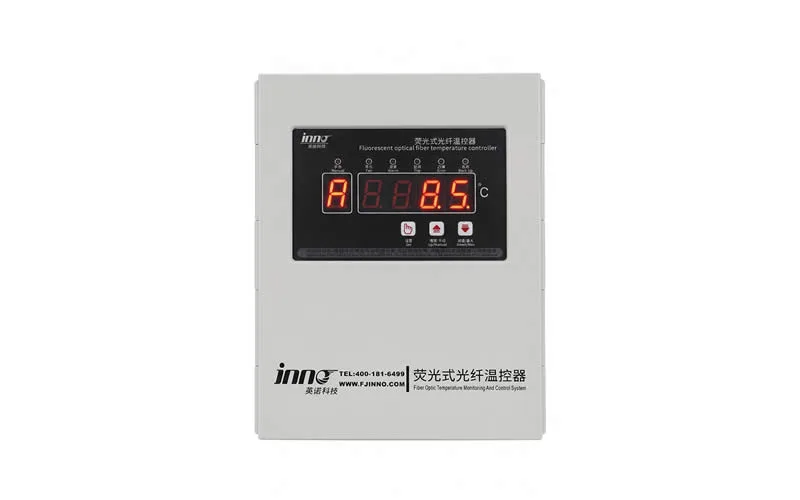
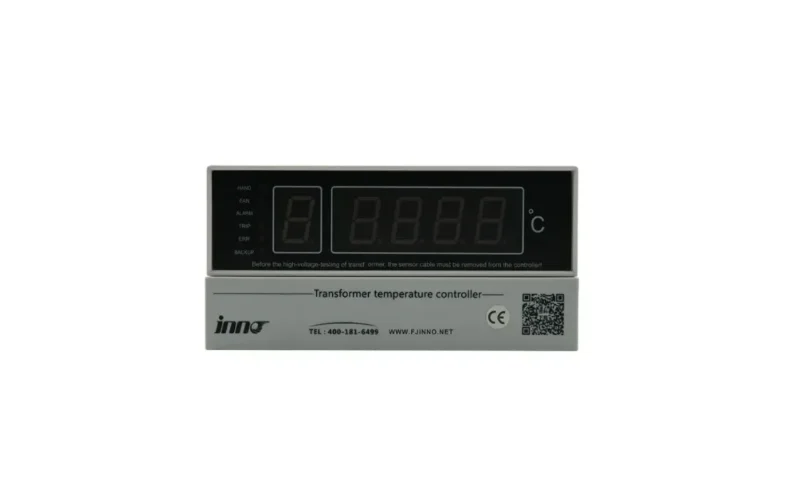
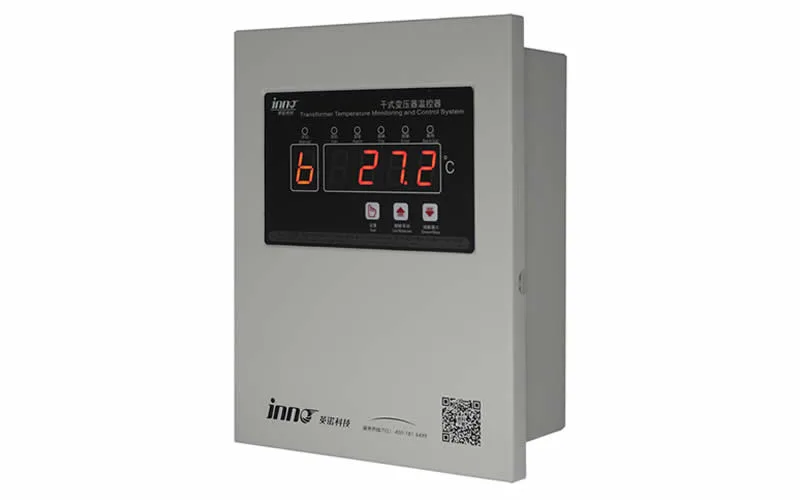
| Multi-channel fiber optic temperature measurement system | Direct temperature at selected measuring points such as windings | Point-type optical probes with transmitter; 1 to 64 channels; -40°C to +240°C range; RS485 Modbus; optional 4-20mA output | Oil-immersed and dry-type transformer winding temperature monitoring, plus other power equipment |
Bushing monitor details such as channel count, sensor type and communication options should be confirmed from project documentation, since they are not listed here.
11.2 Role of Monitoring in Diagnosis
Monitoring systems supply data, alarms and trend records that support condition assessment. They do not replace protection relays, and their output should be evaluated with site inspection, maintenance records and, where required, offline diagnostic testing.
12. When Transformer Diagnostic Testing Is Needed
Further diagnostics become appropriate when evidence suggests a condition that monitoring alone cannot explain, or when a planned maintenance window offers a chance to obtain baseline data. Typical triggers include:
- Abnormal online trends that persist or grow over time
- Repeated alarms from the same parameter
- Unexplained temperature rise at normal loading
- Abnormal gas generation in oil
- Повышение активности PD
- Suspected bushing deterioration
- OLTC abnormality in current, vibration or tap position
- Commissioning of a new or relocated transformer
- Planned maintenance outages
- Post-fault investigation after short circuits or protection operations
Diagnostic testing on energized or high-voltage equipment must be planned and carried out by qualified personnel following owner procedures and applicable standards. Specific test procedures are outside the scope of this article.
12.1 Abnormal Trend During Service
Sustained drift, step changes or rising rates of change in monitored values justify a closer look. The first step is usually to verify the data, check sensors and compare against load and ambient conditions, then to choose a confirming method such as laboratory DGA, thermal imaging or an offline test at the next opportunity.
12.2 Alarm Confirmation and Fault Investigation
Repeated or severe alarms call for a structured investigation. The suspected subsystem guides the choice of method, and independent confirmation helps decide whether the transformer can remain in service, needs restrictions or should be taken out of service.
12.3 Planned Maintenance and Commissioning
Commissioning and planned outages are opportunities to record baseline measurements, including winding tests, SFRA traces, bushing parameters and oil results. Baselines recorded in known-good condition make later online trends and offline comparisons far easier to interpret.
13. Transformer Diagnostics FAQ
13.1 What Is Transformer Diagnostics?
Transformer diagnostics is the use of test results, monitoring data and fault indicators to assess a transformer's present condition and identify likely fault types or locations. It draws on oil analysis, partial discharge data, thermal measurements, electrical tests and insulation checks. Results are interpreted together because one measurement rarely separates every possible cause.
13.2 What Tests Are Used to Diagnose Transformer Faults?
Common tests include dissolved gas analysis, partial discharge measurement, winding resistance, turns ratio, excitation current, short-circuit impedance, SFRA, insulation resistance, tan delta and capacitance measurements, moisture analysis and thermal imaging. Test selection depends on the suspected fault, transformer type and whether the unit can be taken out of service.
13.3 What Is the Difference Between Transformer Diagnostics and Condition Monitoring?
Condition monitoring continuously observes operating parameters and trends, such as temperature, gas levels or partial discharge activity. Diagnostics interprets that data, together with test results, to explain what may be happening and where. Monitoring often triggers diagnostic work, and diagnostic findings help set better baselines and alarm levels.
13.4 Can DGA Identify Transformer Faults?
DGA can indicate fault types such as thermal faults, partial discharge and arcing by comparing gas patterns, ratios and rates of change. It does not locate a fault precisely or confirm its cause on its own. Results should be interpreted against IEC 60599 or IEEE C57.104 guidance and checked with temperature, electrical tests or other measurements.
13.5 Can Partial Discharge Monitoring Diagnose Insulation Defects?
Partial discharge monitoring can indicate insulation defects through discharge magnitude, phase patterns and trends, and it can support classification of discharge type. Pattern interpretation is affected by noise and sensor position, so confirmation typically uses additional methods such as DGA, acoustic or UHF checks, or offline PD measurement.
13.6 What Is the Difference Between Online and Offline Transformer Diagnostics?
Online diagnostics uses data collected while the transformer stays in service, providing trends and early alarms. Offline diagnostics uses planned tests during outages or investigations, giving controlled measurements for fault confirmation. Online data can show when and what to investigate, while offline results often clarify the cause.
13.7 How Is Winding Condition Diagnosed?
Winding condition is typically evaluated with winding resistance, turns ratio, excitation current, short-circuit impedance and SFRA. SFRA compares frequency response traces against baselines, other phases or sister units to indicate geometric change. Results are interpreted with fault history, since deformation may follow short-circuit events or transport.
13.8 How Are Transformer Bushings Diagnosed?
Bushings are diagnosed through capacitance (C1) and tan delta or power factor trends, often supported by thermal imaging, leakage current measurement and partial discharge checks. Offline tests give accurate baselines during outages, while online monitoring tracks changes between outages. Changes are compared with nameplate values, earlier results and other phases.
13.9 When Should Transformer Diagnostic Testing Be Performed?
Diagnostic testing is usually considered after a repeated alarm, an abnormal online trend, unexplained temperature rise, unexpected gas generation, increasing PD activity, suspected bushing deterioration or OLTC abnormality. Commissioning, planned maintenance and post-fault investigation are also common triggers. Timing depends on transformer criticality and on manufacturer and utility practice.
13.10 Can One Diagnostic Test Confirm Every Transformer Fault?
No. Each method is sensitive to certain fault mechanisms and blind to others. DGA responds to decomposition gases, SFRA to winding geometry and tan delta to dielectric losses. Combining methods, with baselines and trend history, reduces ambiguity and supports a more reliable diagnosis.